- System requirements
- Profiler architecture
- Profiler installation
- Uninstall profiler
- Running the profiler
- Profiler activation
- Welcome screen
- Start profiling
- Profiling overhead
- Snapshots
- Solving performance problems
- CPU profiling
- Thread profiling
- Object allocation profiling
- Memory profiling
- Exception profiling
- Telemetry
- Probes: monitor higher level events
- Inspections: automatic recognition of typical problems
- Automatically trigger actions on event
- Automatic deobfuscation
- Summary, automatic deobfuscation
- Filters
- Profiler command line
- Command line tool to control profiling
- Export of profiling results to external formats
- Profiler .NET API
- Profiler HTTP API
- Settings
- Troubleshooting
CPU tracing
CPU tracing or just tracing is one of the CPU profiling modes that YourKit .NET Profiler offers to measure performance of the .NET applications.
CPU tracing works by instrumenting the application code to record every function call and return, along with other relevant information. This allows developers to see a complete history of the application's execution and identify specific code paths that are causing performance issues. With this information, developers can track down and optimize the problematic code paths.
Performance impact
The performance impact of CPU tracing is generally higher than that of CPU sampling. It adds more overhead to the application because it collects a larger amount of data. Due to the additional overhead, CPU tracing may not be suitable for use in production environments, and it is typically used in testing or development environments.
Use CPU tracing when you need a detailed view of the application's execution flow to track down specific code paths causing performance issues. CPU tracing is best suited for use in testing or development environments, where the additional overhead can be tolerated.
CPU tracing settings
You can configure some CPU tracing aspects with
CPU tracing settings.
CPU tracing will be completely disabled if
disable_tracing or
disable_all
agent startup option is specified.
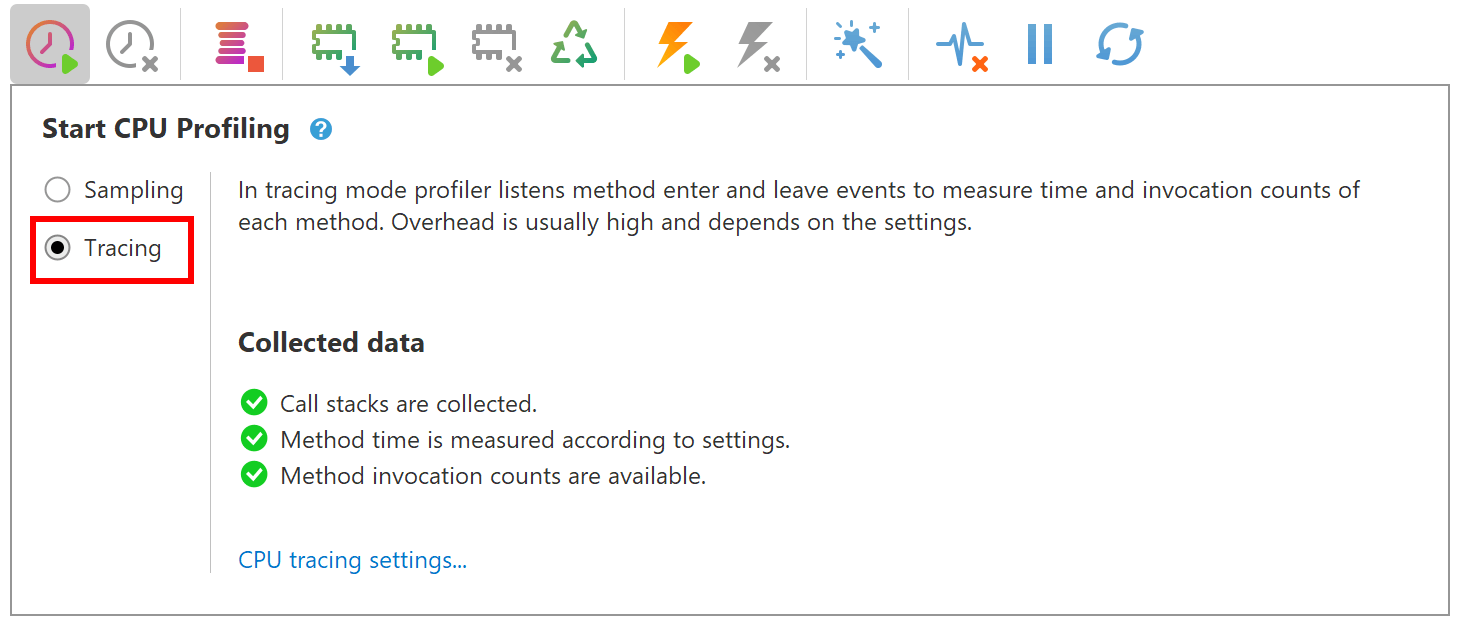
Start CPU tracing
To start CPU tracing, please click
 button in the profiler toolbar, and choose
Tracing option in the
drop-down pane:
button in the profiler toolbar, and choose
Tracing option in the
drop-down pane: