- System requirements
- Profiler architecture
- Profiler installation
- Uninstall profiler
- Running the profiler
- Profiler activation
- Welcome screen
- Start profiling
- Profiling overhead
- Snapshots
- Solving performance problems
- CPU profiling
- Wall time and CPU time
- CPU profiling modes
- CPU usage estimation
- CPU sampling
- CPU sampling settings
- CPU tracing
- CPU tracing settings
- CPU tab
- Telemetry
- Call tree - All threads merged
- Call tree - By thread
- Flame graph
- CPU hot spots
- Method list
- Web and database profiling results
- Callee list view
- Method merged callees view
- Method back traces view
- What-if: an ability to ignore particular methods or focus on particular methods only
- Thread profiling
- Object allocation profiling
- Memory profiling
- Exception profiling
- Telemetry
- Probes: monitor higher level events
- Inspections: automatic recognition of typical problems
- Automatically trigger actions on event
- Automatic deobfuscation
- Summary, automatic deobfuscation
- Filters
- Profiler command line
- Command line tool to control profiling
- Export of profiling results to external formats
- Profiler .NET API
- Profiler HTTP API
- Settings
- Troubleshooting
Web and database profiling results
You can profile applications in high-level terms like SQL statements and URLs. For each web and database call CPU time and invocation count are reported. These results are available in a captured snapshot and not available in "live" mode, when profiler is connected to the profiled application.
High-level results depends on corresponding probes whose activity mode is Auto by default, which means they are active only while CPU profiling is running.
Note, that high-level profiling requires bytecode instrumentation and adds some overhead to the running application. For detailed information, see Profiling overhead: how to reduce or avoid.
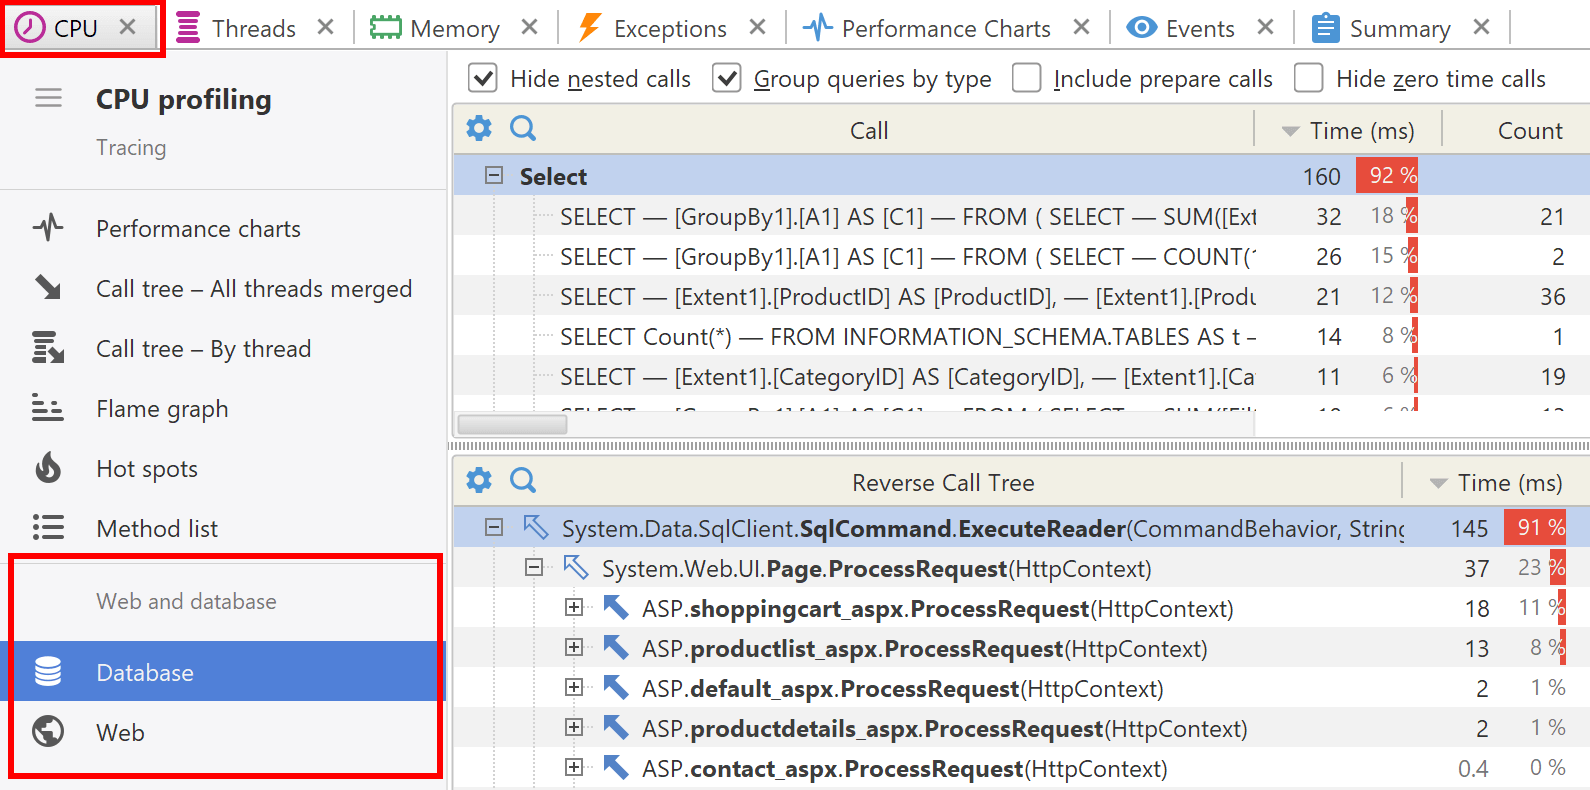
Database
Database section shows requests and their invocation method back traces. You can see the requests as a plain list, or you can group them by type.
Supported database types:
- Cassandra
- MongoDB
- SQL
Web
Shows list a of URLs that correspond to ASP.NET calls, and merged callees for all methods invoked with these URLs.
Actions
Lines can be copied by using File | Copy (Ctrl + C):