- System requirements
- Profiler architecture
- Profiler installation
- Uninstall profiler
- Running the profiler
- Profiler activation
- Welcome screen
- Start profiling
- Profiling overhead
- Snapshots
- Solving performance problems
- CPU profiling
- Thread profiling
- Object allocation profiling
- Memory profiling
- Exception profiling
- Telemetry
- Probes: monitor higher level events
- Inspections: automatic recognition of typical problems
- Automatically trigger actions on event
- Automatic deobfuscation
- Summary, automatic deobfuscation
- Filters
- Profiler command line
- Command line tool to control profiling
- Export of profiling results to external formats
- Profiler .NET API
- Profiler HTTP API
- Settings
- Troubleshooting
- Welcome to YourKit .NET Profiler
- Get started with profiler
- Monitor applications
- Help and demo
- Snapshots
Welcome to YourKit .NET Profiler
The Welcome screen is the initial interface you'll encounter when you launch the YourKit .NET Profiler. It serves as the initial dashboard. Divided into four distinct sections - Get started with profiler, Monitor applications, Help and demo, and Snapshots - the Welcome screen is designed to facilitate easy access to various functionalities and streamline your profiling workflow.
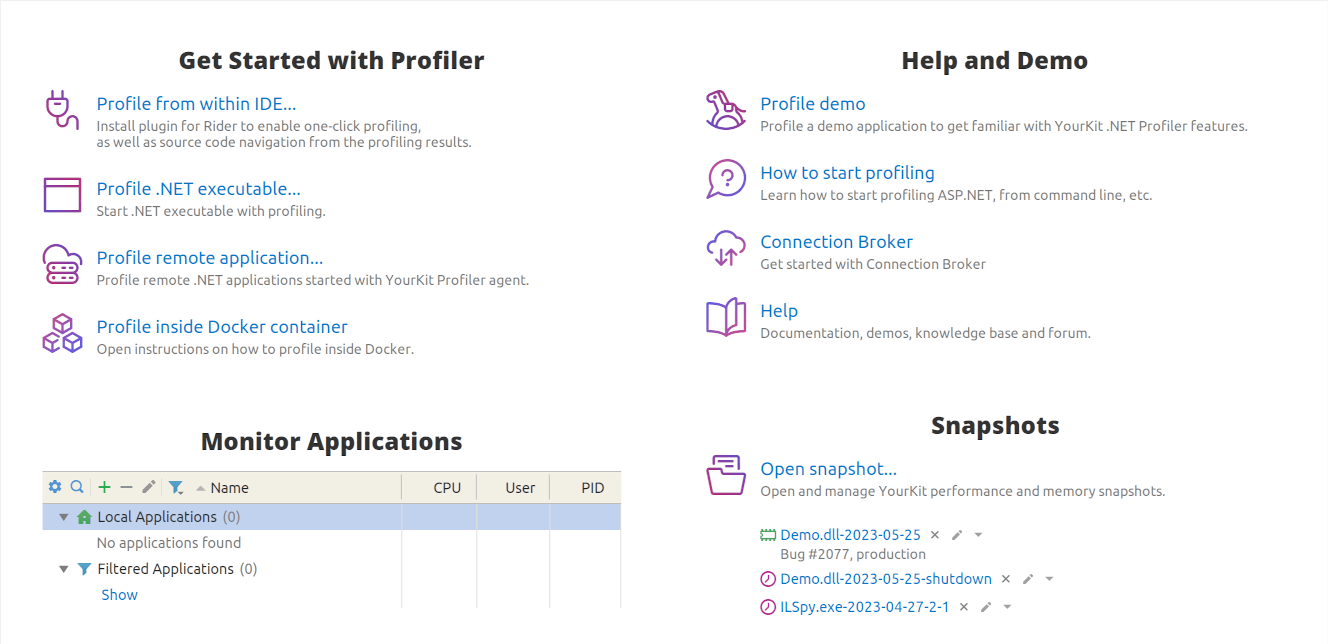
Get started with profiler
The Get Started with Profiler section is designed to jumpstart your profiling activities with quick access to the most frequently used actions and specialized wizards for seamless integration with Internet Information Services (IIS) and Integrated Development Environments (IDEs). Clicking on these shortcuts will initiate the respective tasks or open the specialized wizards, guiding you through the steps needed for configuration or setup.
Monitor applications
The Monitor Applications section lists all the .NET applications that are currently being profiled or monitored. From here, you can:
- Observe the list of profiled applications.
- Connect to profiled applications.
- Create connections and SSH tunnels to the remote applications.
Help and demo
In the Help and Demo section, you'll find resources to aid in your understanding and utilization of YourKit .NET Profiler.
A demo application option is available to let you experiment with the profiler without affecting any live application. It's a great way to familiarize yourself with the tool's features.
Snapshots
This section shows a list of recently opened snapshots, allowing you to quickly revisit your past analyses. Clicking on any of these will open the snapshot, offering you quick access to your past data.