- System requirements
- Profiler architecture
- Profiler installation
- Uninstall profiler
- Running the profiler
- Profiler activation
- Welcome screen
- Start profiling
- Profiling overhead
- Snapshots
- Solving performance problems
- CPU profiling
- Thread profiling
- Object allocation profiling
- Memory profiling
- Exception profiling
- Telemetry
- Probes: monitor higher level events
- Inspections: automatic recognition of typical problems
- Automatically trigger actions on event
- Automatic deobfuscation
- Summary, automatic deobfuscation
- Filters
- Profiler command line
- Command line tool to control profiling
- Export of profiling results to external formats
- Profiler .NET API
- Profiler HTTP API
- Settings
- Troubleshooting
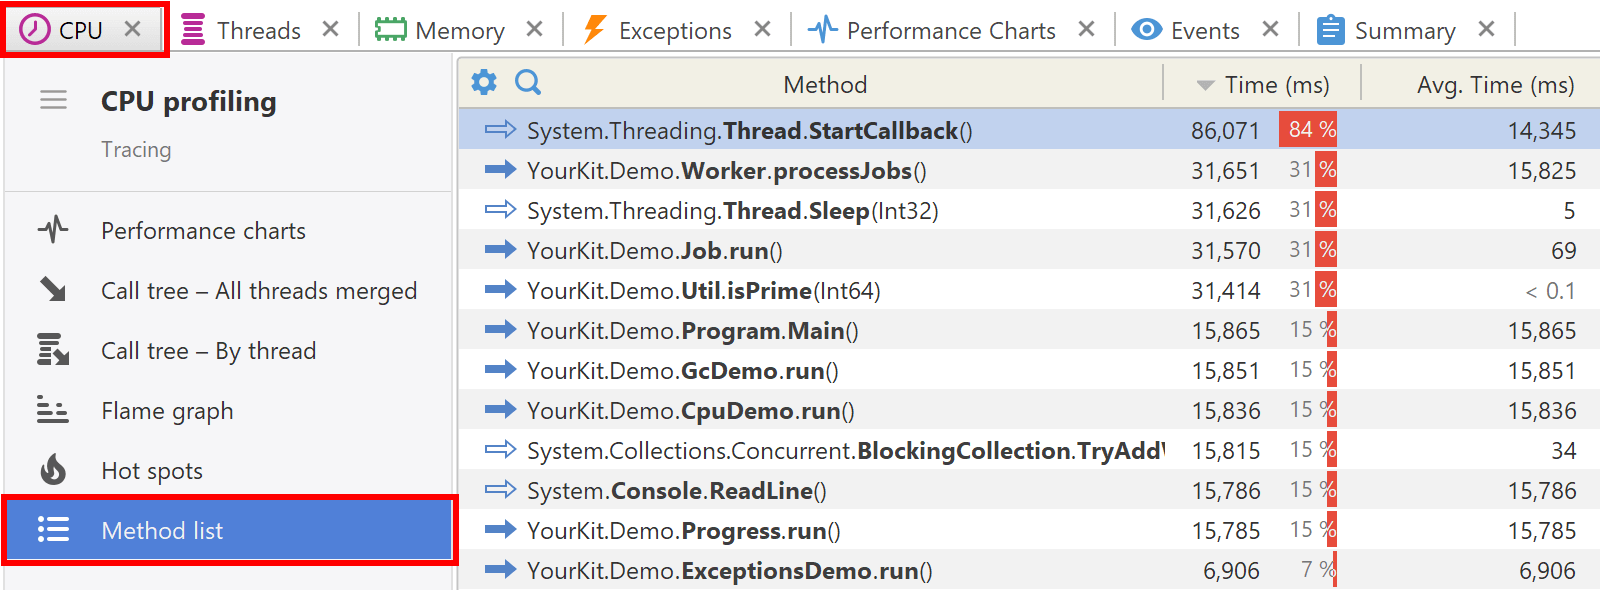
Method list
Method list shows plain list of all called applications methods. If the method was called from different places, then cumulative time and counts will be shown. Unlike the call tree which separates invocations by call stacks, the method list merges together information about all invocations into single line.
The show information depends on CPU profiling mode.
Actions
The following actions are available in the popup menu:
- CPU | Method Merged Callees (Ctrl+M) - shows the method's merged callees.
- CPU | Method Back Traces (Ctrl+Shift+M) - shows the method's back traces.
- Tools | Open in IDE (F7) - opens method declaration in IDE editor (see IDE integration).