- System requirements
- Profiler architecture
- Profiler installation
- Uninstall profiler
- Running the profiler
- Profiler activation
- Welcome screen
- Start profiling
- Profiling overhead
- Snapshots
- Solving performance problems
- CPU profiling
- Thread profiling
- Object allocation profiling
- Memory profiling
- Exception profiling
- Telemetry
- Probes: monitor higher level events
- Inspections: automatic recognition of typical problems
- Automatically trigger actions on event
- Automatic deobfuscation
- Summary, automatic deobfuscation
- Filters
- Profiler command line
- Command line tool to control profiling
- Export of profiling results to external formats
- Profiler .NET API
- Profiler HTTP API
- Settings
- Troubleshooting
Call tree - By thread
Call tree by thread shows an individual top-down call tree for each application thread.
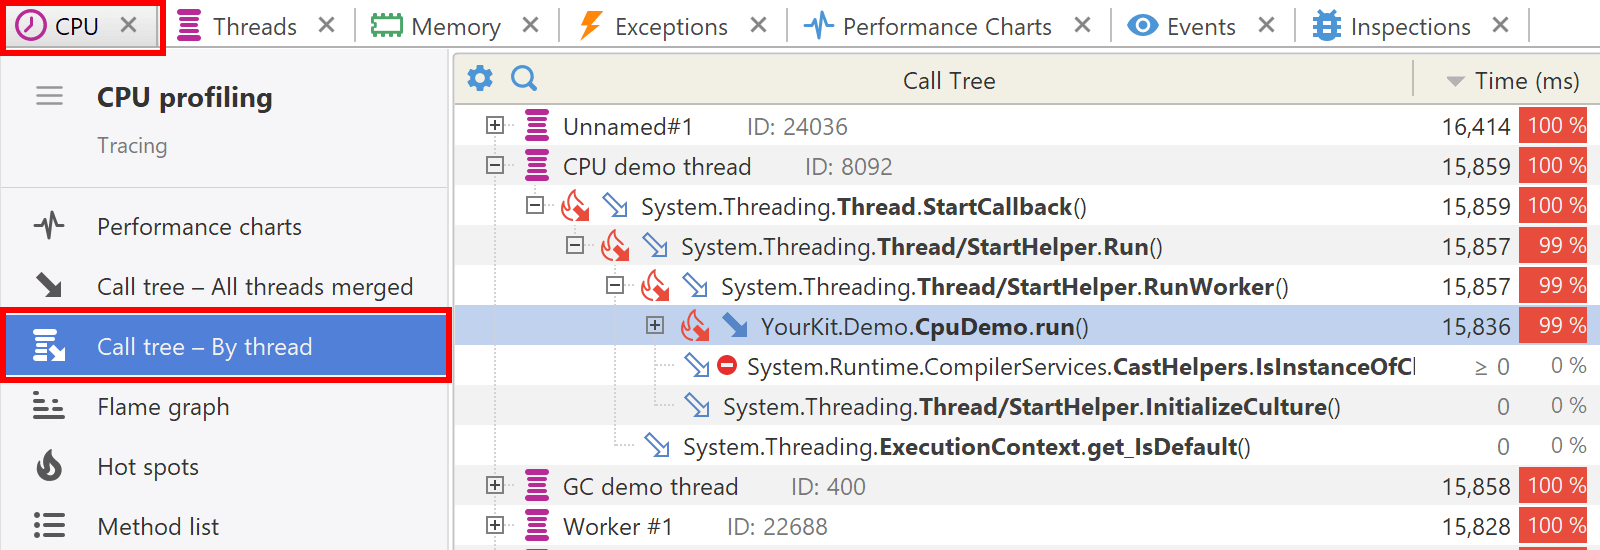
Filters
CPU call tree respects filter settings and collapses filtered methods.
Filtered methods are marked with non-filled arrow icon  ,
and there is <...> hyperlink that allows you to expand hidden content.
You can undo the expansion by using the Ctrl+Z shortcut or from popup menu.
,
and there is <...> hyperlink that allows you to expand hidden content.
You can undo the expansion by using the Ctrl+Z shortcut or from popup menu.
Actions
The following actions are available in main application menu and in the popup menu:
- CPU | Method Merged Callees (Ctrl+M) - shows the method's merged callees.
- CPU | Method Back Traces (Ctrl+Shift+M) - shows the method's back traces.
- Tools | Open in IDE (F7) - opens method declaration in IDE editor (see IDE integration).