- System requirements
- Profiler architecture
- Profiler installation
- Uninstall profiler
- Running the profiler
- Profiler activation
- Welcome screen
- Start profiling
- Profiling overhead
- Snapshots
- Solving performance problems
- CPU profiling
- Thread profiling
- Object allocation profiling
- Memory profiling
- Exception profiling
- Telemetry
- Probes: monitor higher level events
- Inspections: automatic recognition of typical problems
- Automatically trigger actions on event
- Automatic deobfuscation
- Summary, automatic deobfuscation
- Filters
- Profiler command line
- Command line tool to control profiling
- Export of profiling results to external formats
- Profiler .NET API
- Profiler HTTP API
- Settings
- Troubleshooting
Export of profiling results to external formats
YourKit .NET Profiler supports exporting of profiler data into multiple formats. You can integrate profiler data with third-party tools, such as data visualization software, log management systems, or performance analysis tools, to gain a more comprehensive view of your application's performance. DevOps engineers can incorporate profiler into their continuous integration pipelines, enabling automated performance testing and continuous monitoring.
Supported data formats
- CSV (comma separated values)
- HTML, optionally packing all generated files to a single ZIP archive
- PNG, when exporting telemetry charts and flame graphs from the profiler UI
- TXT (plain text)
- XML
Export from UI
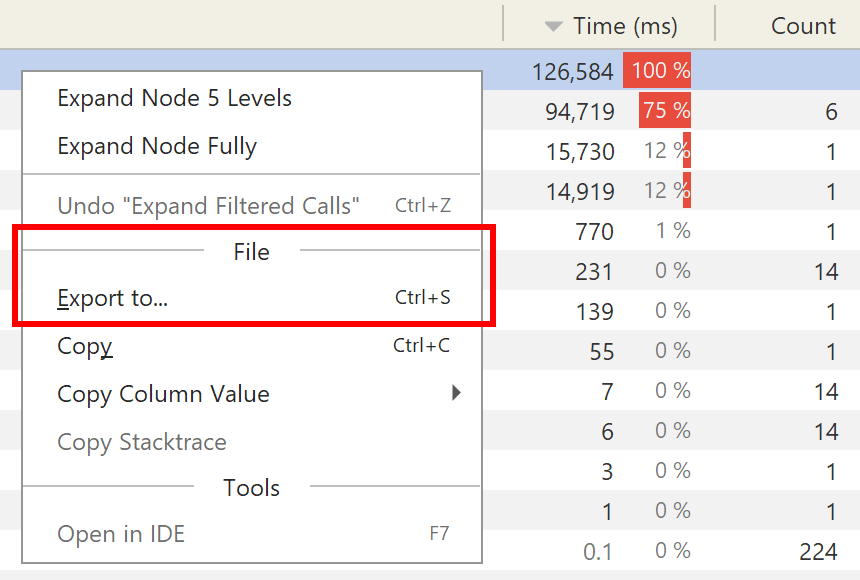
To export a view, use File | Export to... (Ctrl+S) or the popup menu action:
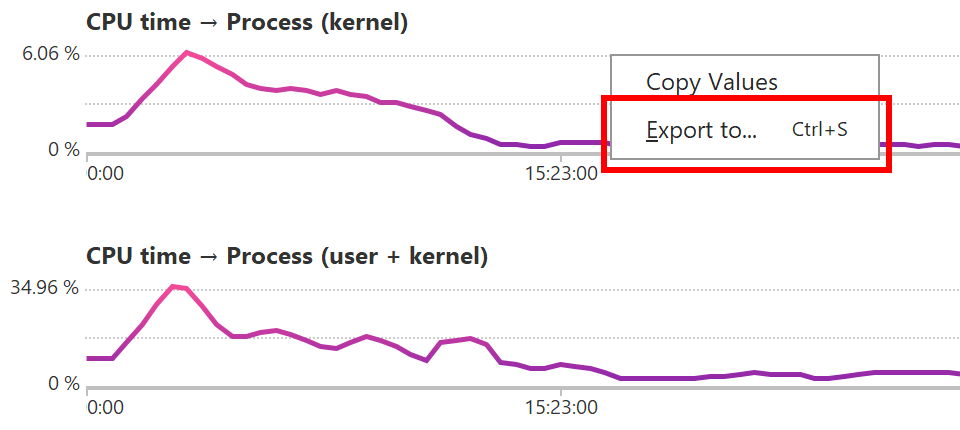
To export a telemetry chart, right-click on it to invoke the popup menu:
File | Copy (Ctrl+C) action copies text of selected row in all trees and lists.
Export from command line
You can automatically export some basic views using the following command:
Linux
<profiler directory>/bin/profiler.sh -export <snapshot_file> <target_directory>macOS
<profiler directory>/Contents/Resources/bin/profiler.sh -export <snapshot_file> <target_directory>Windows
<profiler directory>\bin\profiler.bat -export <snapshot_file> <target_directory>Note: the target directory where the resulting files will be created must exist when you issue the command.
Exported views
By default all the views are exported, if necessary data is present in the snapshot, for example results of CPU profiling or object allocation profiling. For a memory snapshot all strings are exported too.
To export only specific views, set at least one of the system properties. If none of the properties is specified, all available views will be exported.
| Exported views | System property |
| All text strings from a memory snapshot | export.strings |
| CPU / Call tree - All threads merged | export.call.tree.cpu |
| CPU / Call tree - By thread | |
| CPU / Method list | export.method.list.cpu |
| Events / Events by table | export.probes |
| Memory / Allocations / Method list | export.method.list.alloc |
| Memory / Objects by category / Class list | export.class.list |
| Telemetry | export.telemetry |
| Summary | export.summary |
Retained size
By default, the Class list (export.class.list)
and Class loader (export.class.loaders) views
are exported with estimated retained sizes
for the rows for which the exact retained size
cannot be obtained immediately.
To calculate exact retained size for the top rows instead,
please specify the following system properties, individually or in a combination:
-
export.exact.retained.size.min.ms=<milliseconds>- perform exact retained size calculation for each exported view for approximately the specified amount of time, unless there is nothing left to calculate. -
export.exact.retained.size.min.count=<count>- perform exact retained size calculation as long as needed to ensure that at least the specified number of top elements for each exported view will have their exact retained size calculated.
Filters
Filters are not applied when exporting call trees and method lists, in order to provide all available profiling information for further processing. Therefore, the result of the export may be different from what you see in the UI. To apply the filters to the exported results, specify system property:
export.apply.filters
Export formats
By default, views are exported in each of applicable formats: CSV, HTML, TXT, XML. To export in only particular formats, specify one or several of the following system properties:
export.csvexport.htmlexport.txtexport.xml
If at least one of the properties is specified, export will be performed in only specified format(s). If none of the properties is specified, export will be performed in all formats available for each of the views.
Examples
Export all available views, the filters will not be applied:
java -jar yourkit.jar -export <snapshot> <output_dir>Export CPU method list and class list only, and apply filters:
java -Dexport.method.list.cpu -Dexport.class.list -Dexport.apply.filters -jar yourkit.jar -export <snapshot> <output_dir>Export class list only, calculating exact retained sizes for 5 seconds or longer, if it's necessary to calculate it for at least 10 top classes:
java -Dexport.class.list -Dexport.exact.retained.size.min.ms=5000 -Dexport.exact.retained.size.min.count=10 -jar yourkit.jar -export <snapshot> <output_dir>Export class list only, calculating exact retained sizes for at least 10 top classes:
java -Dexport.class.list -Dexport.exact.retained.size.min.count=10 -jar yourkit.jar -export <snapshot> <output_dir>Export all available views, and only as CSV:
java -Dexport.csv -jar yourkit.jar -export <snapshot> <output_dir>Export CPU method list and class list only, and only as text:
java -Dexport.method.list.cpu -Dexport.class.list -Dexport.txt -jar yourkit.jar -export <snapshot> <output_dir>