- System requirements
- Profiler architecture
- Profiler installation
- Uninstall profiler
- Running the profiler
- Profiler activation
- Welcome screen
- Start profiling
- Profiling overhead
- Snapshots
- Solving performance problems
- CPU profiling
- Thread profiling
- Object allocation profiling
- Memory profiling
- Exception profiling
- Telemetry
- Probes: monitor higher level events
- Inspections: automatic recognition of typical problems
- Automatically trigger actions on event
- Automatic deobfuscation
- Summary, automatic deobfuscation
- Filters
- Profiler command line
- Command line tool to control profiling
- Export of profiling results to external formats
- Profiler .NET API
- Profiler HTTP API
- Settings
- Troubleshooting
CPU profiling
CPU profiling is a form of dynamic program analysis that measures the time and frequency with which various functions or instructions are executed during the program's run. This is critical for optimizing code, identifying bottlenecks, and ensuring that an application scales efficiently. Use CPU profiling to optimize performance and to minimize latency or response time.
- Goals of CPU profiling
- Common problems and solutions
- Start CPU profiling
- Monitoring live results
- Capture performance snapshot
- Best practices
- Alternate options to start CPU profiling
Goals of CPU profiling
1. Identify bottlenecks: To locate the sections of code where most of the CPU time is spent.
2. Improve efficiency: To refactor or optimize the inefficient parts of the code.
3. Analyze CPU utilization: To understand how the application uses CPU and to check if it is evenly distributed across cores and threads.
4. Optimize scalability: To ensure that the application can handle more tasks or users without degrading performance.
Common problems and solutions
High CPU usage
Problem: The application is consuming an excessive amount of CPU.
Solution: Profile your application to identify which methods or operations are consuming the most CPU time. Optimize the method or use more efficient algorithms or data structures.
Uneven multithreading
Problem: CPU usage is uneven across threads, leading to poor performance.
Solution: Look for thread synchronization issues, such as locks and semaphores that may be causing some threads to wait unnecessarily.
Infrequent but long-running operations
Problem: The application generally performs well but occasionally has spikes in CPU usage.
Solution #1: Estimate CPU usage by statistical profiling, it can give you valuable insights into the performance characteristics of your .NET application.
Solution #2: Profile the application over an extended period and look for occasional methods or operations that are expensive in terms of CPU time. Optimize these parts of the code or offload them to a separate thread or process.
Start CPU profiling
When the profiler is connected to an application, the toolbar shows these CPU profiling controls:
| Toolbar button | Description |

|
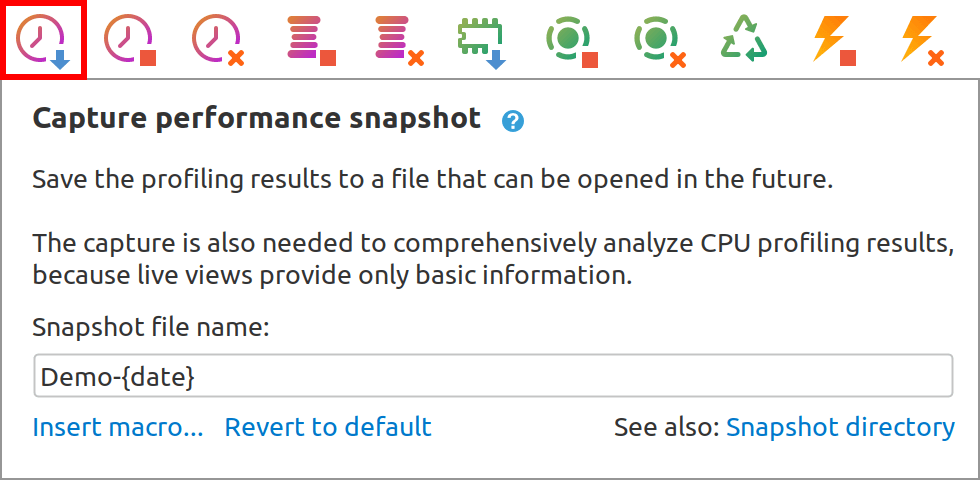
Capture performance snapshot - save the profiling results to a file for comprehensive analysis. |


|
Start/Stop CPU profiling. |

|
Clear recorded CPU profiling results and continue CPU profiling. |
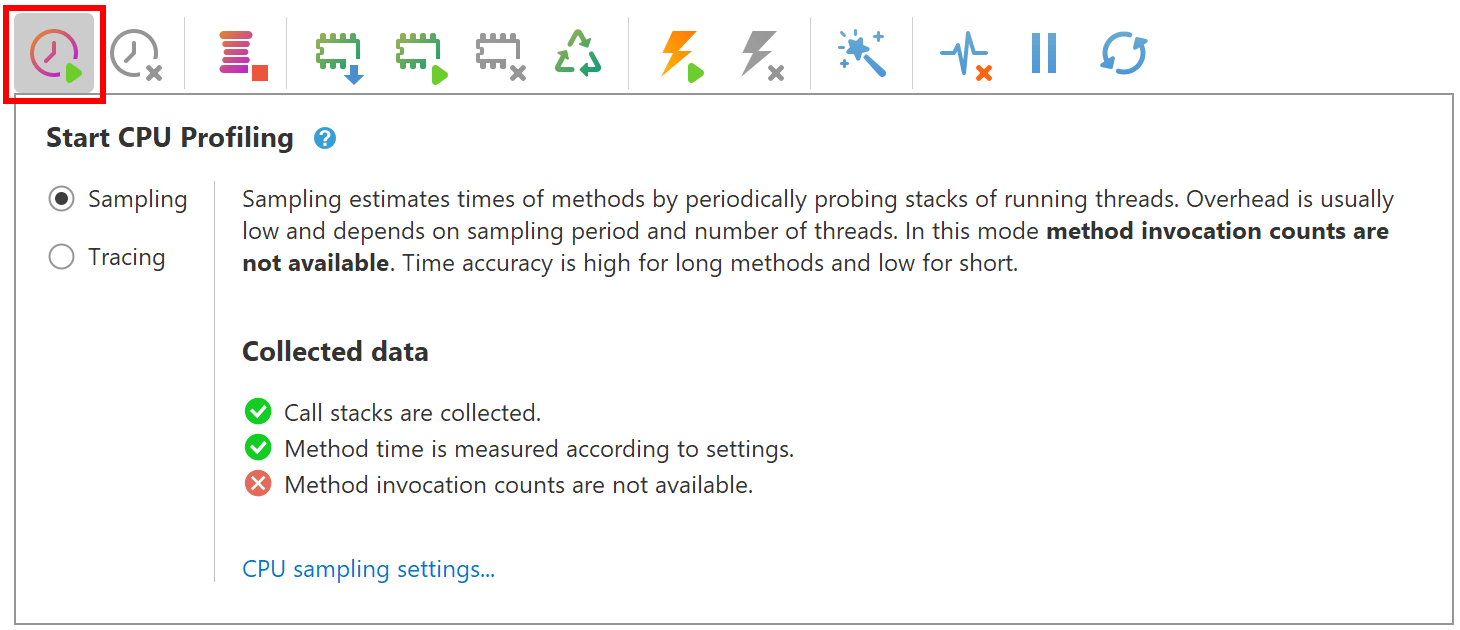
Choose CPU profiling mode
To start CPU profiling choose preferred
CPU profiling mode and click
button in the toolbar:
You can start and stop CPU profiling during the execution of your application as many times as you want. When CPU profiling is not running, the profiler adds no performance overhead to application being profiled.
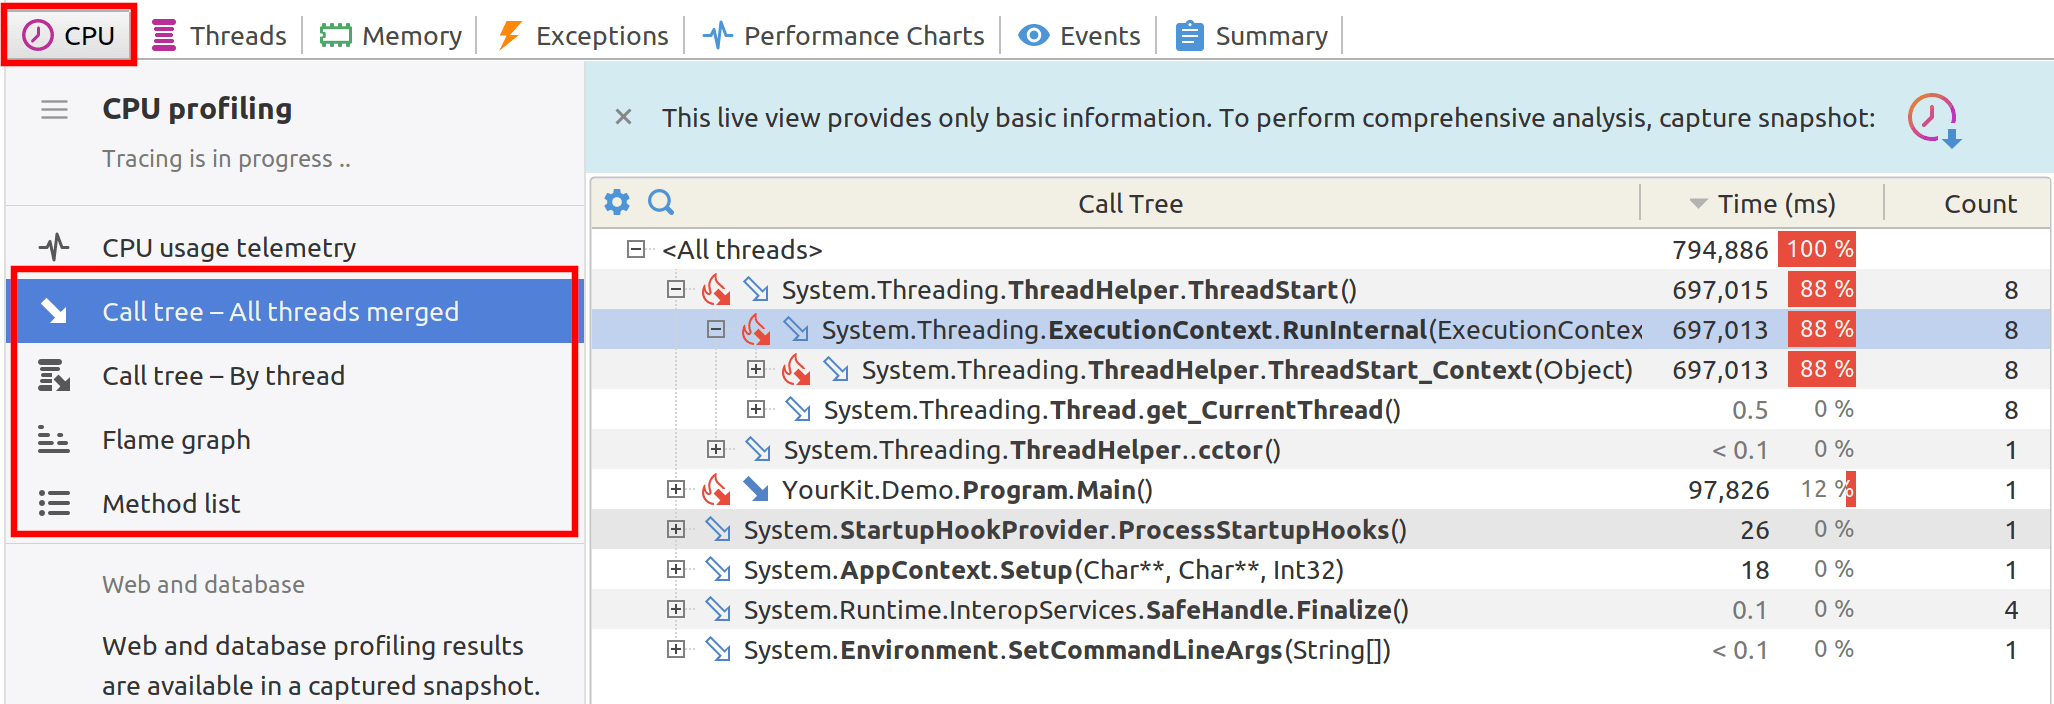
Monitoring live results
Once CPU profiling is started, the results will be immediately available in the Call tree - All threads merged, Call tree - By thread, Flame graph and Method list views that are on the CPU tab. You can also use the CPU telemetry charts to observe performance metrics of your .NET application.
Please note, the live views provide only basic information. When the task you intended to profile has finished (or has performed for a sufficient amount of time), capture a performance snapshot with all the recorded information for further comprehensive analysis.
Capture performance snapshot
Capture performance snapshot after collecting enough data. If you profile for too short a time, you might miss issues that only appear intermittently. On the other hand, profiling for too long may make it harder to sift through the data.
Best practices
1. Use sampling: Instead of tracing every method call, use sampling to collect data over a period to reduce the overhead of profiling.
2. Focus on key CPU consumers: When analyzing profiling data, prioritize the functions or operations that consume the most CPU time. Focusing on these for optimization will yield the most significant performance gains.
3. Detect anomalies: Keep an eye out for unusual spikes or drops in CPU usage or other metrics that could indicate a problem. Investigate these anomalies to find root causes and to optimize accordingly.
4. Monitor telemetry charts: Continuously monitor telemetry charts that track key metrics like CPU usage, memory consumption, and thread activity. This practice can help you identify trends, anticipate issues, and make proper optimization decisions.
5. Profile in a production-like environment: Always profile in an environment that closely mimics the production setting.
6. Analyze and iterate: Profiling is not a one-time task. It's an iterative process that should be part of the development lifecycle.
7. Avoid premature optimization: Do not optimize without profiling data to back your changes. This might make the code more complex without any substantial gain in performance.
8. Compare before and after: Always compare the performance metrics before and after making optimizations to validate that they have the intended effect.
Alternate options to start CPU profiling
Startup options
It may be useful to launch the application with CPU profiling right from the start. Learn more about profiler agent startup options.
Command line tool
Command line tool is designed to control profiling modes in headless environments.
Profiler API
API class YourKit.Profiler.Api.Controller for each profiling mode
has a corresponding method to start CPU profiling.
Triggers
Profiler built-in triggers allow to start CPU profiling on high CPU usage, periodically, or by other conditions.