- System requirements
- Profiler architecture
- Profiler installation
- Uninstall profiler
- Running the profiler
- Profiler activation
- Welcome screen
- Start profiling
- Profiling overhead
- Snapshots
- Solving performance problems
- CPU profiling
- Thread profiling
- Object allocation profiling
- Memory profiling
- Exception profiling
- Telemetry
- Probes: monitor higher level events
- Inspections: automatic recognition of typical problems
- Automatically trigger actions on event
- Automatic deobfuscation
- Summary, automatic deobfuscation
- Filters
- Profiler command line
- Command line tool to control profiling
- Export of profiling results to external formats
- Profiler .NET API
- Profiler HTTP API
- Settings
- Troubleshooting
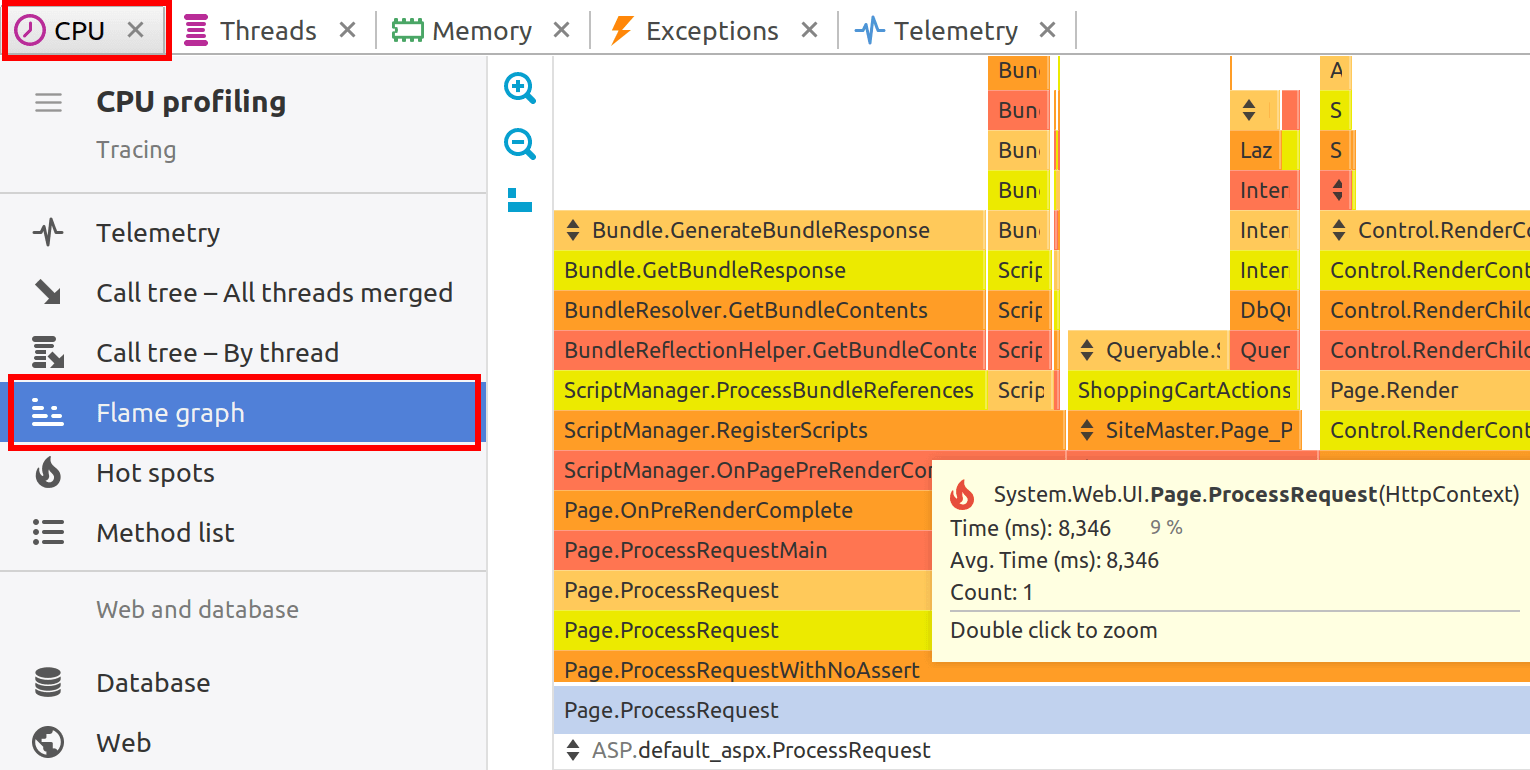
Flame graph
CPU flame graph is a way to visualize the entire application call tree, which allows to find performance bottlenecks quickly and easily. Execution paths which consume most of the CPU time are wider and more visible on the graph.
Flame graph is available in both live mode, when you profile the running application, and when you analyze captured snapshot. In live mode graph updates in real time, when UI synchronizes with profiler agent.
Layout
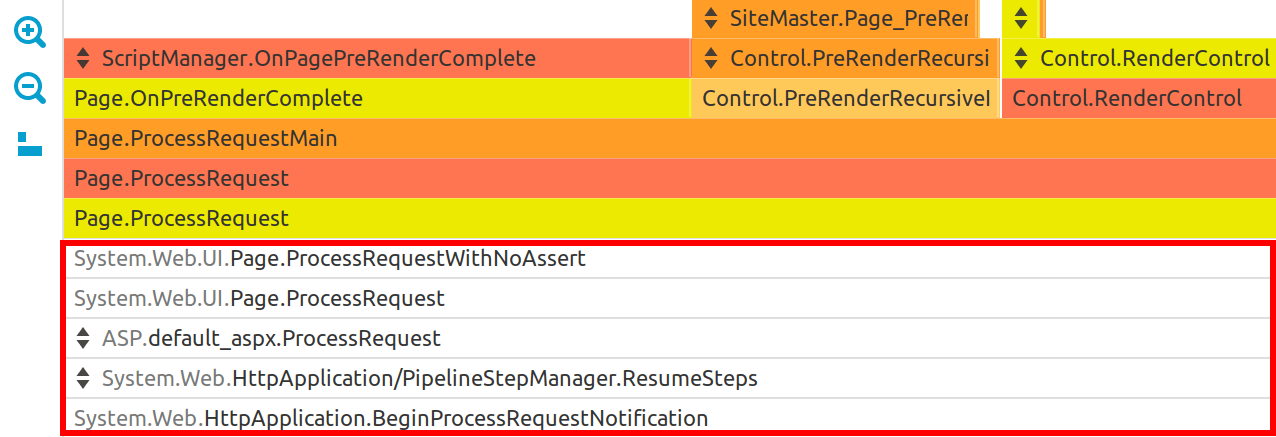
Along horizontal axis flame graph draws the stacks sorted by execution time. You always see the longest methods at the left side of the graph, that simplifies analyzes.
The width of the graph element is proportional to the time of the corresponding stack frame. The wider the element the more time it consumed.
Call stacks are laid out vertically, and grow from bottom to top. That is similar to stack traces you can see printed in a console.
Colors
The colors of the graph have no meaning, they just visually separate neighbour elements and are chosen from a flame palette. Red color of an element does not mean that the corresponding method consumes more CPU time.
Legend
When you move the mouse pointer over the graph elements, the balloon with legend
will be shown. It displays the fully qualified method name with parameter types,
consumed time and the number of invocations (if available). The hot spot methods are marked
with  icon.
icon.
Zoom
Sometimes you may want to closely inspect a short method. Usually short methods are narrow and the graph is not able to show its called methods. In this case you can zoom in the method. The whole graph will be scaled and zoomed element will occupy entire screen width, revealing hidden details. Zoom in is activated by double-click or from popup menu. ESC resets zoom and returns graph to its original scale.
Filters
Flame graph respects filter settings and collapse filtered methods the same way as it does
CPU call tree. Inside filtered elements you will see small button
 that allows to unfilter the element.
You can always undo unfiltering by using the Ctrl+Z shortcut or from popup menu.
that allows to unfilter the element.
You can always undo unfiltering by using the Ctrl+Z shortcut or from popup menu.
Actions
The following actions are available in the popup menu:
- File | Export to... (Ctrl+S) - exports flame graph to PNG image.
- Tools | Open in IDE (F7) - opens method declaration in IDE editor. See IDE integration.