- System requirements
- Profiler architecture
- Profiler installation
- Uninstall profiler
- Running the profiler
- Profiler activation
- Welcome screen
- Start profiling
- Profiling overhead
- Snapshots
- Solving performance problems
- CPU profiling
- Thread profiling
- Object allocation profiling
- Memory profiling
- Exception profiling
- Telemetry
- Probes: monitor higher level events
- Inspections: automatic recognition of typical problems
- Automatically trigger actions on event
- Automatic deobfuscation
- Summary, automatic deobfuscation
- Filters
- Profiler command line
- Command line tool to control profiling
- Export of profiling results to external formats
- Profiler .NET API
- Profiler HTTP API
- Settings
- Troubleshooting
Object allocation profiling
Creating objects (allocating memory in the heap) is an expensive operation. Therefore, creating a large number of temporary objects can significantly slow down a .NET application and add an extra load on the garbage collector. The .NET runtime will have to perform garbage collection more frequently, causing pauses in execution, which will ultimately negatively impact application performance.
- Goals of object allocation profiling
- How to control object allocation profiling
- Allocations tab
- Allocation profiling settings and overhead
- Best practices
Goals of object allocation profiling
- Identify parts of the code that generate the most temporary objects and put a strain on the garbage collector.
- Allocation profiling helps with fixing memory leaks. Additional information about where a specific object was created helps answer why it still exists in memory.
How to control object allocation profiling
You can start and stop object allocation profiling at any time while your application is running. When object allocations are not recorded, the profiler adds no overhead to the application.
Profiler UI
When the profiler is connected to an application, the toolbar shows these allocation profiling controls:
| Toolbar button | Description |


|
Start/Stop allocation profiling. |

|
Clear allocation profiling results and continue profiling. |
Agent startup options
The following agent startup options control object allocation profiling. You can enable profiling from application startup, configure parameters for recording allocation data, and disable certain profiling capabilities to fine-tune profiler overhead:
HTTP API
If you need remote control or automation in your profiling workflow, YourKit .NET Profiler lets you manage allocation profiling using HTTP API endpoints:
.NET API
The YourKit .NET Profiler also provides a
.NET API
for deep integration with .NET applications.
The YourKit.Profiler.Api.Controller
includes methods for starting,
stopping, and resetting the allocation profiling,
similar to the toolbar buttons.
Allocations tab
The results of object allocation profiling can be analyzed from different perspectives:
- Telemetry charts.
- Class - Allocated objects grouped by their class.
- Allocation tree - All threads merged - Displays methods that allocated objects, organized into a single combined call tree across all threads.
- Allocation tree - By thread - Displays methods that allocated objects, organized into separate call trees per .NET thread.
- Flame graph - Displays methods that allocated objects as a flame graph.
- Hot spots by object count - Methods allocating the highest number of objects.
- Hot spots by object size - Methods allocating the most memory.
- Method list - Provides a complete list of all methods responsible for object allocations.
Allocation profiling settings and overhead
Profiler overhead directly depends on the number of objects for which the profiler records a stack trace. The fewer stack traces the profiler records, the lower the overhead. YourKit .NET Profiler provides options that allow efficient allocation profiling while maintaining moderate performance overhead:
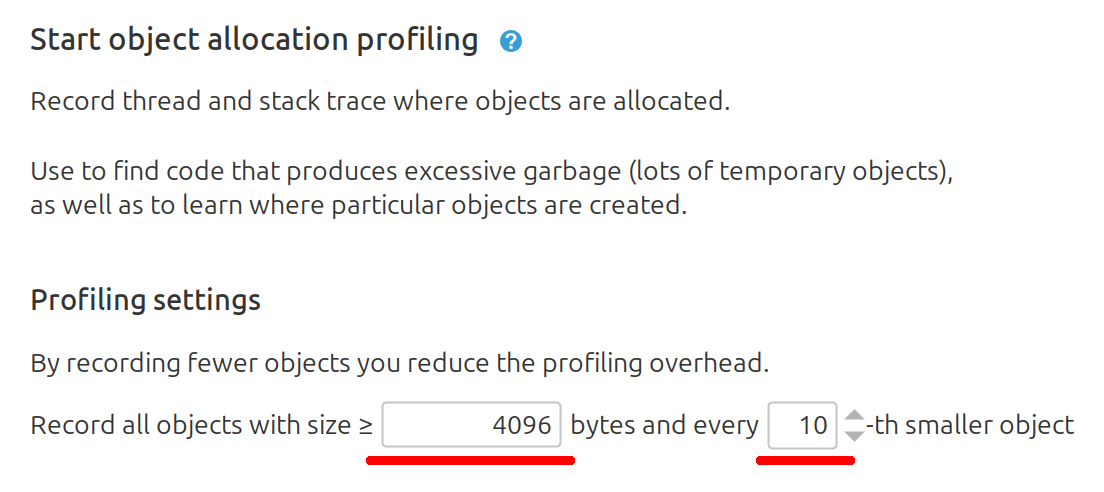
- The first option specifies the minimum object size for which an allocation stack trace is always recorded. For example, if the minimum size is set to 4KiB, stack traces will be recorded for the creation of all objects of 4KiB or larger. This ensures that all significant allocations are captured.
- But what if the program creates many small objects? For this, there is a second option: "record every N-th object smaller than the minimum size". This option allows collecting statistical data on the creation of small objects.
As a result, with moderate performance impact, we can obtain complete information about all large object allocations and statistical data on small object allocations.
Best practices
Choose the right profiling options
Choose reasonable profiling settings to keep profiling overhead moderate. In most cases, it is not necessary to track the creation location of every object.
Limit profiling duration
Since object allocation profiling adds overhead to your .NET application, we recommend not keeping this mode enabled all the time. For example, if you want to profile object allocations when your web application processes an HTTP request, the optimal approach would be:
- Start allocation profiling just before executing the request.
- Execute the request, take a snapshot, and stop allocation profiling.
- Analyze the data in the snapshot.
With this approach, you can minimize performance impact and even profile in a production environment.
Validate changes
Always baseline performance before changes and re-measure after.