- System requirements
- Profiler architecture
- Profiler installation
- Uninstall profiler
- Running the profiler
- Profiler activation
- Welcome screen
- Start profiling
- Profiling overhead
- Snapshots
- Solving performance problems
- CPU profiling
- Thread profiling
- Object allocation profiling
- Memory profiling
- Exception profiling
- Telemetry
- Probes: monitor higher level events
- Inspections: automatic recognition of typical problems
- Automatically trigger actions on event
- Automatic deobfuscation
- Summary, automatic deobfuscation
- Filters
- Profiler command line
- Command line tool to control profiling
- Export of profiling results to external formats
- Profiler .NET API
- Profiler HTTP API
- Settings
- Troubleshooting
CPU sampling
CPU sampling or just sampling is one of the CPU profiling modes that YourKit .NET Profiler offers to measure performance of the .NET applications.
How CPU sampling works
CPU sampling works by taking periodic stack snapshots of the application's call stack to identify which functions are currently executing. Over time, a pattern emerges as certain functions are seen to be executing more frequently than others. The frequency with which a function appears in the sampled call stacks indicates its relative contribution to the total CPU time. By focusing on the functions that appear most often, developers can pinpoint performance bottlenecks.
It's important to note that because CPU sampling takes periodic stack snapshots, it doesn't capture every method invocation. This means that it can't provide an exact count of how many times a specific method was called. The data is statistical in nature and is meant to give an overall view of where the application spends most of its CPU time.
Performance overhead
The performance impact of CPU sampling is generally low. It adds some overhead to the application, but the impact is often minimal because the sampling frequency is typically low. It is a lightweight method and is usually suitable for use in production environments. Please read this article if you want to learn more about how to reduce or avoid the impact of the profiler.
Use CPU sampling when you want a lightweight method to identify performance bottlenecks with minimal impact on the application. CPU sampling is suitable for use in production environments or when a high-level overview of the application's performance is sufficient.
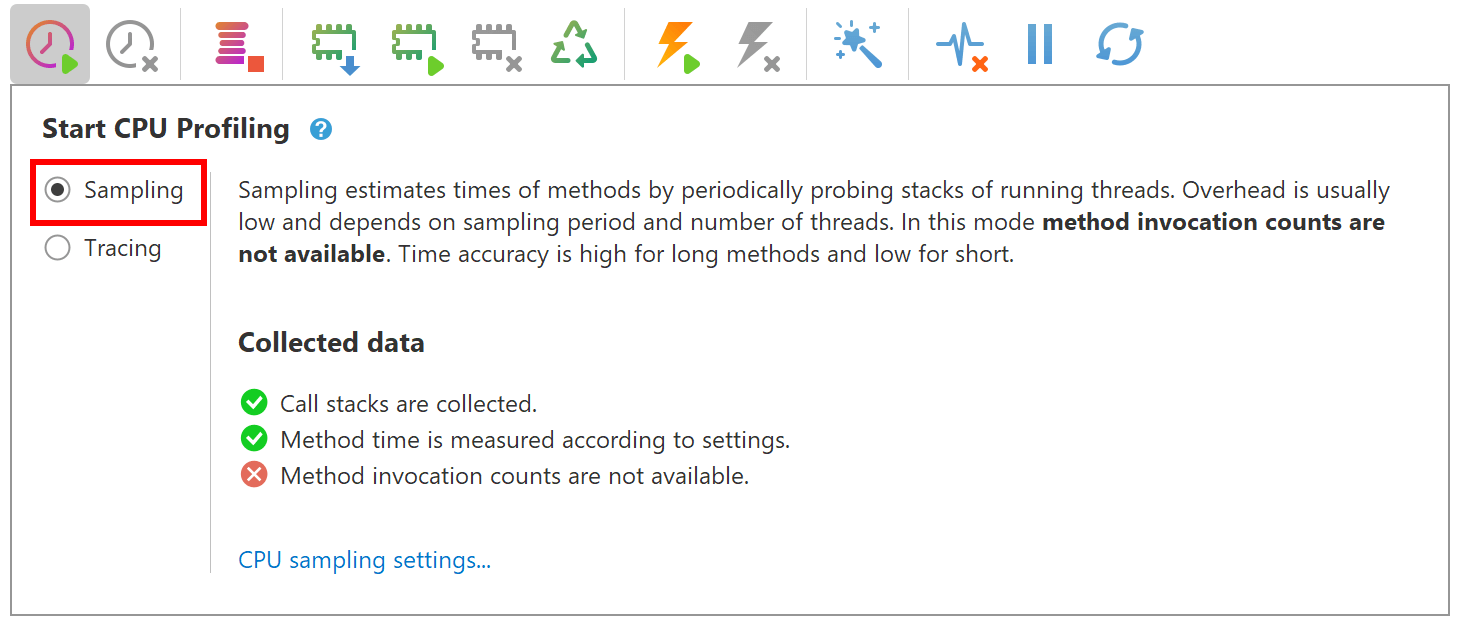
Start CPU sampling
To start CPU sampling, please click
 button in the profiler toolbar, and choose
Sampling option in the
drop-down pane:
button in the profiler toolbar, and choose
Sampling option in the
drop-down pane:
CPU sampling settings
You can configure some CPU sampling aspects with CPU sampling settings.