- System requirements
- Profiler architecture
- Profiler installation
- Uninstall profiler
- Running the profiler
- Profiler activation
- Welcome screen
- Start profiling
- Profiling overhead
- Snapshots
- Solving performance problems
- CPU profiling
- Thread profiling
- Virtual threads support
- Object allocation profiling
- Memory profiling
- Monitor profiling
- Exception profiling
- Telemetry
- Probes: monitor events of various kinds
- Events in user interface
- Event table
- Profiler events in table 'Messages'
- Event timeline
- Event call tree
- Event stack traces
- Navigation between views
- Events in range
- Event inspections
- Built-in probes
- Probe classes
- Monitoring method invocation events
- Probe class annotation @MethodPattern
- Callback onEnter()
- Callback onReturn()
- Callback onExit()
- Callbacks onUncaughtException() and onUncaughtExceptionExt()
- Parameter annotation @Param
- Parameter annotation @Params
- Parameter annotation @This
- Parameter annotation @ClassRef
- Parameter annotation @MethodName
- Parameter annotation @MethodTimeMs
- Parameter annotation @MethodTimeNs
- Parameter annotation @MethodParameterTypes
- Parameter annotation @MethodSignature
- Parameter annotation @OnEnterResult
- Parameter annotation @ReturnValue
- Parameter annotation @ThrownException
- Probe application rules
- Data storage
- Inspections: automatic recognition of typical problems
- Automatically trigger actions on event
- Automatic deobfuscation
- Summary
- Filters
- Profiler command line
- Export of profiling results to external formats
- Profiler Java API
- Profiler HTTP API
- Settings
- Troubleshooting and FAQ
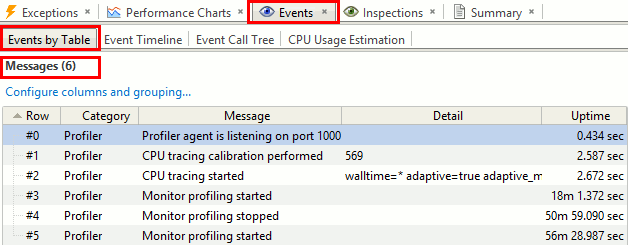
Profiler events in table 'Messages'
Profiler events such as switching profiling modes, starting/stopping profiling, capturing snapshots etc. are logged to the log file, as well to built-in table "Messages" (categories "Profiler" and "Profiler UI").
You can add your own messages in your probes via API
class com.yourkit.probes.builtin.Messages.
You can see "Messages" table in the probes UI: