- System requirements
- Profiler architecture
- Profiler installation
- Uninstall profiler
- Running the profiler
- Profiler activation
- Welcome screen
- Start profiling
- Profiling overhead
- Snapshots
- Solving performance problems
- CPU profiling
- Thread profiling
- Virtual threads support
- Object allocation profiling
- Memory profiling
- Monitor profiling
- Exception profiling
- Telemetry
- Probes: monitor events of various kinds
- Inspections: automatic recognition of typical problems
- Automatically trigger actions on event
- Automatic deobfuscation
- Summary
- Filters
- Profiler command line
- Export of profiling results to external formats
- Profiler Java API
- Profiler HTTP API
- Settings
- Troubleshooting and FAQ
Virtual threads support
Virtual threads, introduced in Java 21, are lightweight threads that simplifies concurrent programming by allowing to write code in a synchronous style while achieving the scalability benefits of asynchronous, non-blocking I/O. Unlike traditional Java threads, which map directly to OS threads and are limited by system resources, virtual threads are managed by the JVM and can scale to millions of concurrent tasks without a significant resource strain.
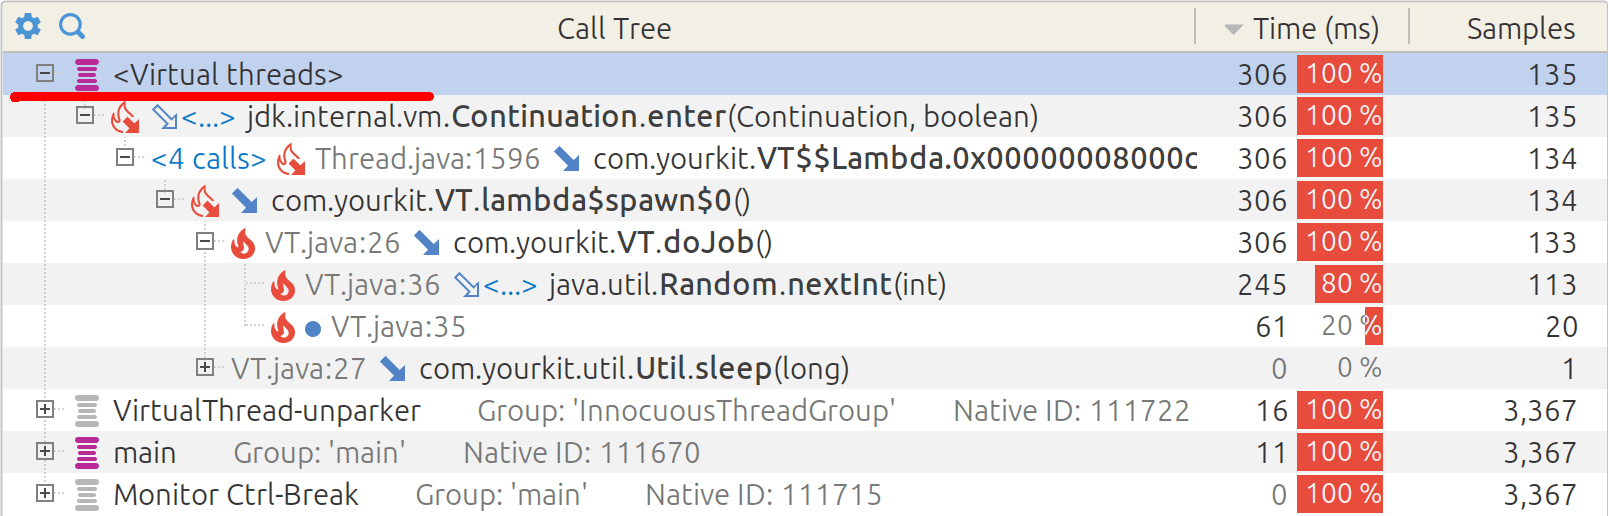
YourKit Java Profiler fully supports profiling of Java virtual threads in all profiling modes, including asynchronous CPU sampling, CPU tracing, and object allocation profiling. In the call trees, the stacks of all virtual threads are merged together and grouped under the <Virtual threads> node.
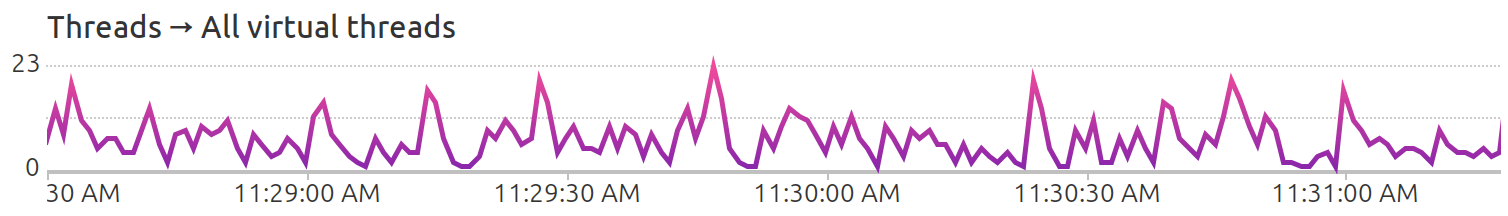
The Telemetry view includes a All virtual threads chart, which displays the number of virtual threads in the JVM.