- System requirements
- Profiler architecture
- Profiler installation
- Uninstall profiler
- Running the profiler
- Profiler activation
- Welcome screen
- Start profiling
- Profiling overhead
- Snapshots
- Solving performance problems
- CPU profiling
- Thread profiling
- Virtual threads support
- Object allocation profiling
- Memory profiling
- Monitor profiling
- Exception profiling
- Telemetry
- Probes: monitor events of various kinds
- Inspections: automatic recognition of typical problems
- Automatically trigger actions on event
- Automatic deobfuscation
- Summary
- Filters
- Profiler command line
- Export of profiling results to external formats
- Profiler Java API
- Profiler HTTP API
- Settings
- Troubleshooting and FAQ
Thread profiling
- Goals of thread profiling
- Thread profiling modes
- Controlling thread profiling
- Threads tab
- Threads in HPROF snapshot
Goals of thread profiling
Thread profiling provides insights into the behavior and interactions of threads in a Java application, helping to identify concurrency issues that may impact performance. By periodically recording thread states and call stacks, it enables analysis of state distribution, detection of bottlenecks or deadlocks, estimation of CPU usage, and identification of frozen threads. This low-overhead process offers valuable information for optimizing thread interactions and resource utilization without significantly affecting application performance.
Thread profiling modes
States and stacks mode
Periodically record states and stacks of running threads. This information makes it possible to build a timeline of thread states, as well as to estimate CPU usage and enables frozen thread detection.
Retrieving thread states and stacks incurs low overhead, primarily because these operations are conducted infrequently. This overhead is significantly lower when compared to CPU profiling.
States mode
Periodically record only the states of running threads. Thread stacks are not recorded and the CPU usage estimation will be unavailable, but profiling overhead will be lower.
Controlling thread profiling
Profiler UI
When the profiler is connected to the profiled application, the toolbar contains the following exception profiling controls:
| Toolbar Button | Description |


|
Start/Stop thread profiling. |

|
Clear thread profiling results. |
When thread profiling is started, previous results are cleared automatically.
Agent startup options
Thread profiling collects states and stacks by default.
Interval for collecting this data is set to 1 second and limited to 1 hour.
However, this can be adjusted with startup options
threads,
telemetry_period,
telemetry_limit.
HTTP API
For users requiring remote control or automation within their profiling workflows, YourKit Java Profiler offers control over the thread profiling through HTTP API endpoints. The documentation outlines startThreadProfiling, stopThreadProfiling and resetThreadProfiling methods available for this purpose.
Java API
The YourKit Java Profiler also provides a
Java API
for deep integration with Java applications.
The com.yourkit.api.controller.v2.Controller
includes methods for starting,
stopping, and resetting the thread profiling, similar to the toolbar buttons.
Threads tab
Thread profiling tab offers a suite of tools to analyze thread behavior, providing insights into performance and concurrency issues. These views help in understanding thread interactions:
- Telemetry charts showing thread-related performance metrics over time.
- Thread states timeline of thread state transitions, such as running, waiting, blocked, and more.
- Deadlocks detection for identifying deadlocks between Java threads.
- Frozen threads helps identify threads that are unresponsive or stuck.
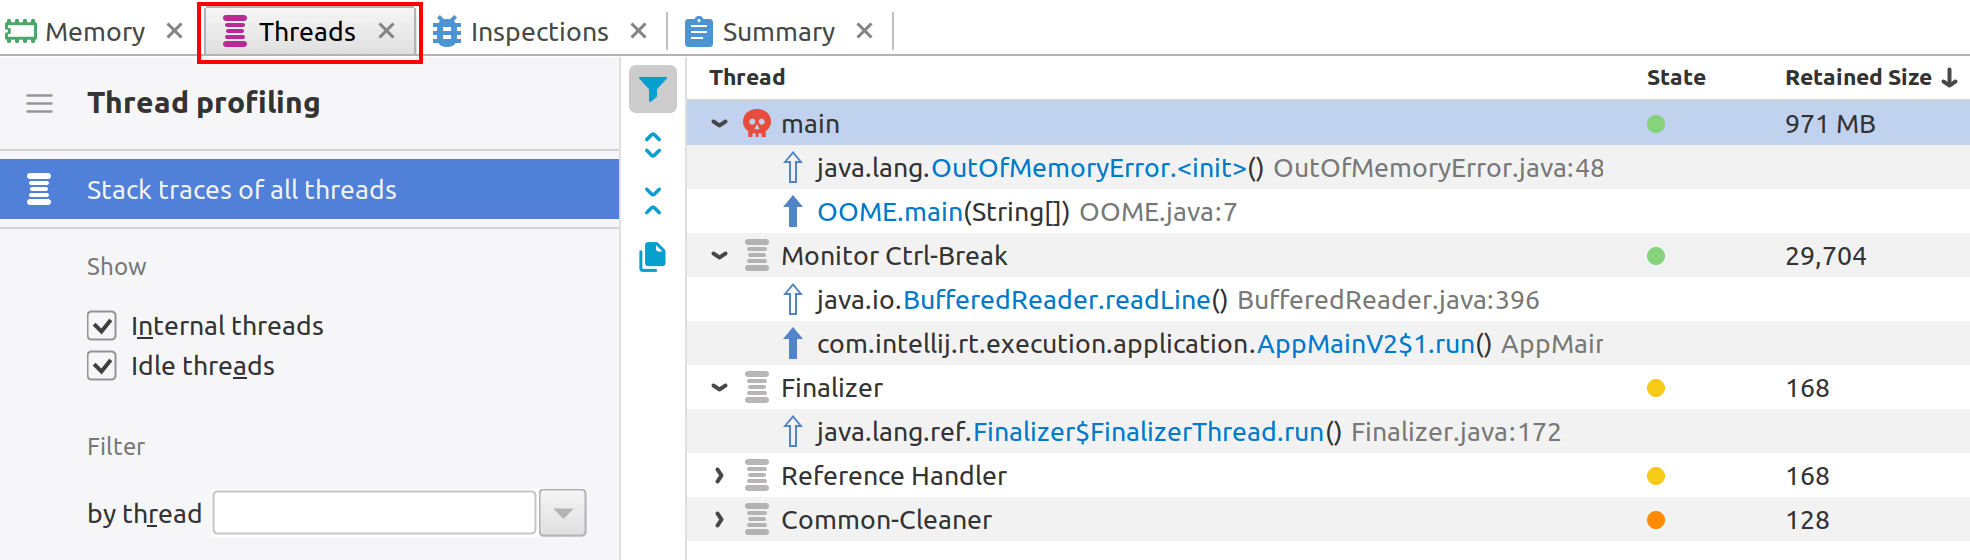
Threads in HPROF snapshot
HPROF snapshot can optionally contain information about running threads, their stacks, and their states. In the Threads tab you can examine the list of threads and their stacks.
If an OutOfMemoryError occurred in the program
during the invocation of a Java object constructor
<init>,
YourKit Java Profiler will locate this thread and highlight it
with a special
 icon.
icon.