- System requirements
- Profiler architecture
- Profiler installation
- Uninstall profiler
- Running the profiler
- Profiler activation
- Welcome screen
- Start profiling
- Profiling overhead
- Snapshots
- Solving performance problems
- CPU profiling
- Thread profiling
- Virtual threads support
- Object allocation profiling
- Memory profiling
- Monitor profiling
- Exception profiling
- Telemetry
- Probes: monitor events of various kinds
- Events in user interface
- Event inspections
- Built-in probes
- Probe classes
- Monitoring method invocation events
- Probe class annotation @MethodPattern
- Callback onEnter()
- Callback onReturn()
- Callback onExit()
- Callbacks onUncaughtException() and onUncaughtExceptionExt()
- Parameter annotation @Param
- Parameter annotation @Params
- Parameter annotation @This
- Parameter annotation @ClassRef
- Parameter annotation @MethodName
- Parameter annotation @MethodTimeMs
- Parameter annotation @MethodTimeNs
- Parameter annotation @MethodParameterTypes
- Parameter annotation @MethodSignature
- Parameter annotation @OnEnterResult
- Parameter annotation @ReturnValue
- Parameter annotation @ThrownException
- Probe application rules
- Data storage
- Inspections: automatic recognition of typical problems
- Automatically trigger actions on event
- Automatic deobfuscation
- Summary
- Filters
- Profiler command line
- Export of profiling results to external formats
- Profiler Java API
- Profiler HTTP API
- Settings
- Troubleshooting and FAQ
Events in range
Instead of examining all recorded events, you can focus on events intersecting with given event or group of events.
For example, select event corresponding to particular servlet request, to see nested events such as database operations, file I/O, socket connections etc.
To invoke the action, use popup menu:
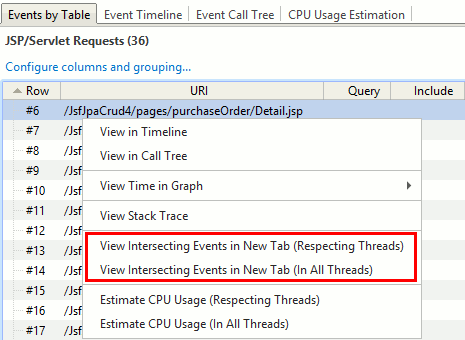
As the result, a new "Events" tab will open.