- System requirements
- Profiler architecture
- Profiler installation
- Uninstall profiler
- Running the profiler
- Profiler activation
- Welcome screen
- Start profiling
- Profiling overhead
- Snapshots
- Solving performance problems
- CPU profiling
- Thread profiling
- Virtual threads support
- Object allocation profiling
- Memory profiling
- Monitor profiling
- Exception profiling
- Telemetry
- Probes: monitor events of various kinds
- Events in user interface
- Event table
- Event timeline
- Event call tree
- Event stack traces
- Navigation between views
- Events in range
- Event inspections
- Built-in probes
- Probe classes
- Monitoring method invocation events
- Probe class annotation @MethodPattern
- Callback onEnter()
- Callback onReturn()
- Callback onExit()
- Callbacks onUncaughtException() and onUncaughtExceptionExt()
- Parameter annotation @Param
- Parameter annotation @Params
- Parameter annotation @This
- Parameter annotation @ClassRef
- Parameter annotation @MethodName
- Parameter annotation @MethodTimeMs
- Parameter annotation @MethodTimeNs
- Parameter annotation @MethodParameterTypes
- Parameter annotation @MethodSignature
- Parameter annotation @OnEnterResult
- Parameter annotation @ReturnValue
- Parameter annotation @ThrownException
- Probe application rules
- Data storage
- Inspections: automatic recognition of typical problems
- Automatically trigger actions on event
- Automatic deobfuscation
- Summary
- Filters
- Profiler command line
- Export of profiling results to external formats
- Profiler Java API
- Profiler HTTP API
- Settings
- Troubleshooting and FAQ
Navigation between views
Navigation inside "Events" tab
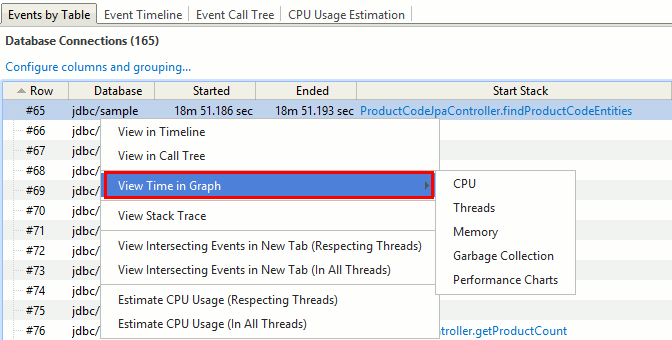
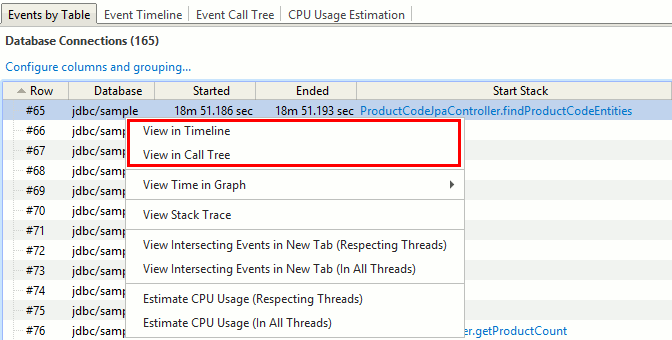
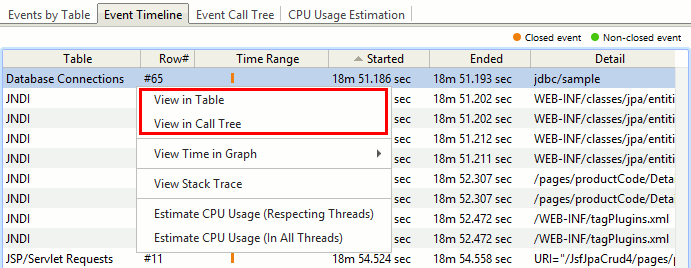
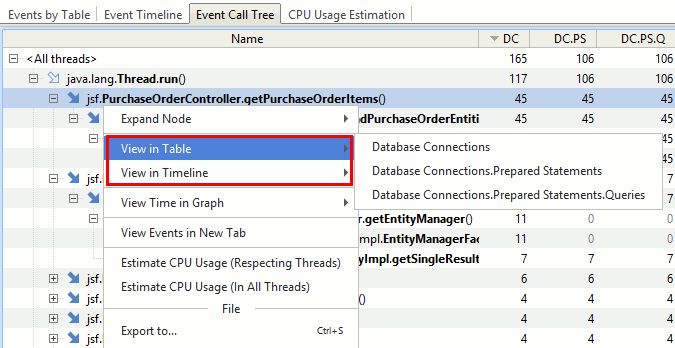
To open event(s) selected in Event table, Event timeline or Event call tree in another view, use corresponding popup menu items:
-
In "Event table":
-
In "Event timeline":
-
In "Event call tree":
Navigation from "Events" to graphs
To open event(s) selected in a telemetry graph, use corresponding popup menu items: