- System requirements
- Profiler architecture
- Profiler installation
- Uninstall profiler
- Running the profiler
- Profiler activation
- Welcome screen
- Start profiling
- Profiling overhead
- Snapshots
- Solving performance problems
- CPU profiling
- Thread profiling
- Virtual threads support
- Object allocation profiling
- Memory profiling
- Monitor profiling
- Exception profiling
- Telemetry
- Probes: monitor events of various kinds
- Events in user interface
- Event inspections
- Built-in probes
- com.yourkit.probes.builtin.Threads
- Class loading probe
- com.yourkit.probes.builtin.AwtEvents
- Probe classes
- Monitoring method invocation events
- Probe class annotation @MethodPattern
- Callback onEnter()
- Callback onReturn()
- Callback onExit()
- Callbacks onUncaughtException() and onUncaughtExceptionExt()
- Parameter annotation @Param
- Parameter annotation @Params
- Parameter annotation @This
- Parameter annotation @ClassRef
- Parameter annotation @MethodName
- Parameter annotation @MethodTimeMs
- Parameter annotation @MethodTimeNs
- Parameter annotation @MethodParameterTypes
- Parameter annotation @MethodSignature
- Parameter annotation @OnEnterResult
- Parameter annotation @ReturnValue
- Parameter annotation @ThrownException
- Probe application rules
- Data storage
- Inspections: automatic recognition of typical problems
- Automatically trigger actions on event
- Automatic deobfuscation
- Summary
- Filters
- Profiler command line
- Export of profiling results to external formats
- Profiler Java API
- Profiler HTTP API
- Settings
- Troubleshooting and FAQ
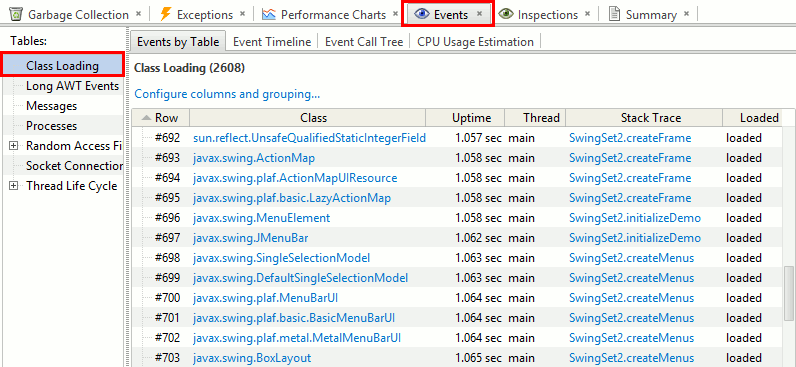
Class loading probe
Description
Probe records class load and unload events.
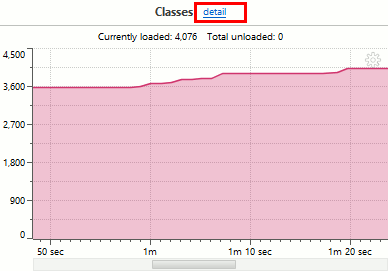
Results are available in the probes UI in table "Class Loading".
You can quickly access them from "Classes" telemetry clicking link "Detail...":
Enabling/disabling the probe via startup options
Use probe name com.yourkit.probes.builtin.ClassLoading
in corresponding agent startup options,
e.g. probe_off=com.yourkit.probes.builtin.ClassLoading
disables the class loading probe.