- System requirements
- Profiler architecture
- Profiler installation
- Uninstall profiler
- Running the profiler
- Profiler activation
- Welcome screen
- Start profiling
- Profiling overhead
- Snapshots
- Solving performance problems
- CPU profiling
- Thread profiling
- Virtual threads support
- Object allocation profiling
- Memory profiling
- Monitor profiling
- Exception profiling
- Telemetry
- Probes: monitor events of various kinds
- Events in user interface
- Event inspections
- Built-in probes
- Probe classes
- Monitoring method invocation events
- Probe class annotation @MethodPattern
- Callback onEnter()
- Callback onReturn()
- Callback onExit()
- Callbacks onUncaughtException() and onUncaughtExceptionExt()
- Parameter annotation @Param
- Parameter annotation @Params
- Parameter annotation @This
- Parameter annotation @ClassRef
- Parameter annotation @MethodName
- Parameter annotation @MethodTimeMs
- Parameter annotation @MethodTimeNs
- Parameter annotation @MethodParameterTypes
- Parameter annotation @MethodSignature
- Parameter annotation @OnEnterResult
- Parameter annotation @ReturnValue
- Parameter annotation @ThrownException
- Probe application rules
- Data storage
- Inspections: automatic recognition of typical problems
- Automatically trigger actions on event
- Automatic deobfuscation
- Summary
- Filters
- Profiler command line
- Export of profiling results to external formats
- Profiler Java API
- Profiler HTTP API
- Settings
- Troubleshooting and FAQ
Event table
This view shows events in a particular table. If the table has dependent tables, they are presented as dependent views:
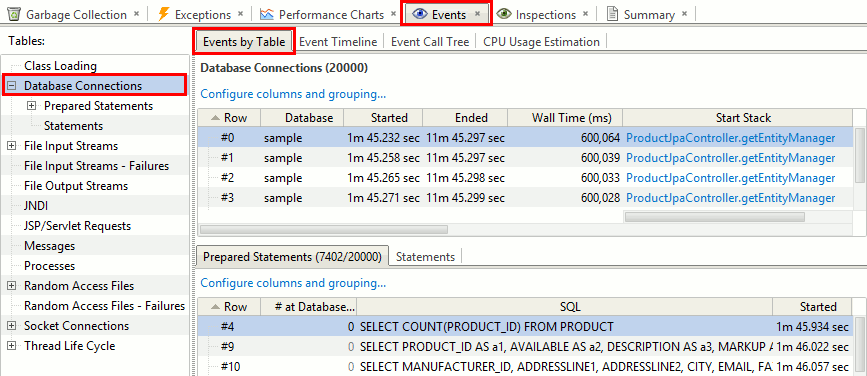
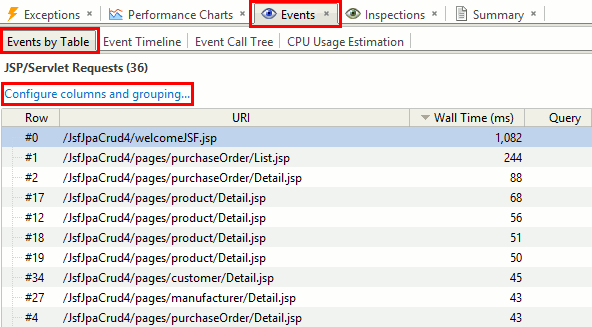
Number of events in table is shown in the title.
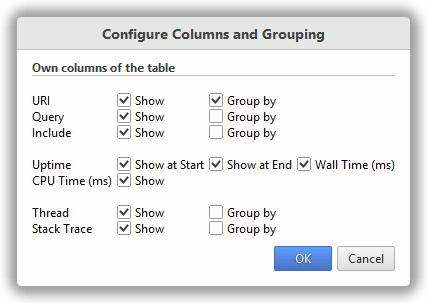
Table columns. Grouping and visibility.
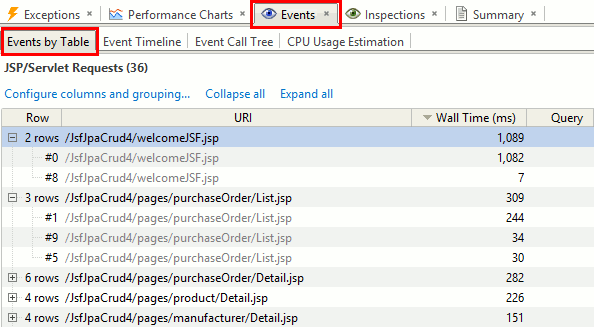
Events can be presented as a plain list, as well as grouped by arbitrary column(s).
For each group you can see sum, minimum and maximum values for numeric columns.
In addition to own table columns, you can also get statistics on associated rows of dependent columns: the number of the rows, as well as sum, minimum and maximum values of the dependent table's metrics.
Also, you can hide columns to give more space for others.
All this can be configured via "Configure columns and groping" action:
Navigation between views
To open selected event(s) in another view, use corresponding popup menu items. Read more...