- System requirements
- Profiler architecture
- Profiler installation
- Uninstall profiler
- Running the profiler
- Profiler activation
- Welcome screen
- Start profiling
- Profiling overhead
- Snapshots
- Solving performance problems
- CPU profiling
- Thread profiling
- Virtual threads support
- Object allocation profiling
- Memory profiling
- Monitor profiling
- Exception profiling
- Telemetry
- Probes: monitor events of various kinds
- Events in user interface
- Event inspections
- Built-in probes
- Probe classes
- Monitoring method invocation events
- Probe class annotation @MethodPattern
- Callback onEnter()
- Callback onReturn()
- Callback onExit()
- Callbacks onUncaughtException() and onUncaughtExceptionExt()
- Parameter annotation @Param
- Parameter annotation @Params
- Parameter annotation @This
- Parameter annotation @ClassRef
- Parameter annotation @MethodName
- Parameter annotation @MethodTimeMs
- Parameter annotation @MethodTimeNs
- Parameter annotation @MethodParameterTypes
- Parameter annotation @MethodSignature
- Parameter annotation @OnEnterResult
- Parameter annotation @ReturnValue
- Parameter annotation @ThrownException
- Probe application rules
- Data storage
- Inspections: automatic recognition of typical problems
- Automatically trigger actions on event
- Automatic deobfuscation
- Summary
- Filters
- Profiler command line
- Export of profiling results to external formats
- Profiler Java API
- Profiler HTTP API
- Settings
- Troubleshooting and FAQ
Event stack traces
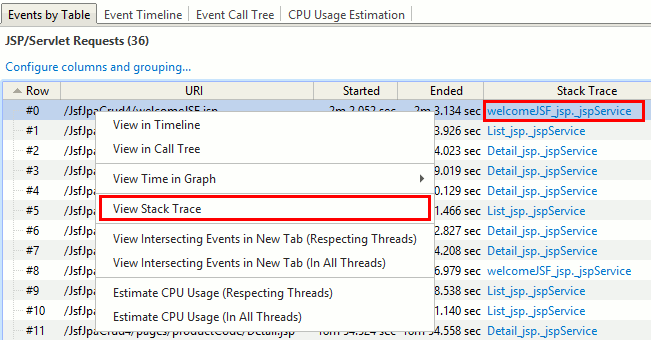
If event stack trace is available, top method is shown as a hyperlink. To see the stack trace, click the link or use a popup menu:
The stack is recorded when event starts and when event ends. You can also estimate CPU usage inside the event.
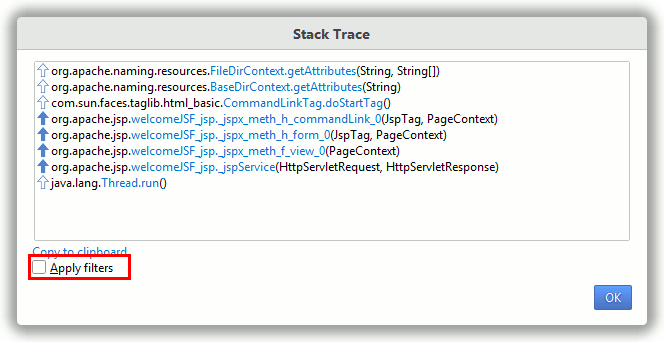
You can apply filters or see full stack trace: