- System requirements
- Profiler architecture
- Profiler installation
- Uninstall profiler
- Running the profiler
- Profiler activation
- Welcome screen
- Start profiling
- Profiling overhead
- Snapshots
- Solving performance problems
- CPU profiling
- Thread profiling
- Object allocation profiling
- Memory profiling
- Exception profiling
- Telemetry
- Probes: monitor higher level events
- Inspections: automatic recognition of typical problems
- Automatically trigger actions on event
- Automatic deobfuscation
- Summary, automatic deobfuscation
- Filters
- Profiler command line
- Command line tool to control profiling
- Export of profiling results to external formats
- Profiler .NET API
- Profiler HTTP API
- Settings
- Troubleshooting
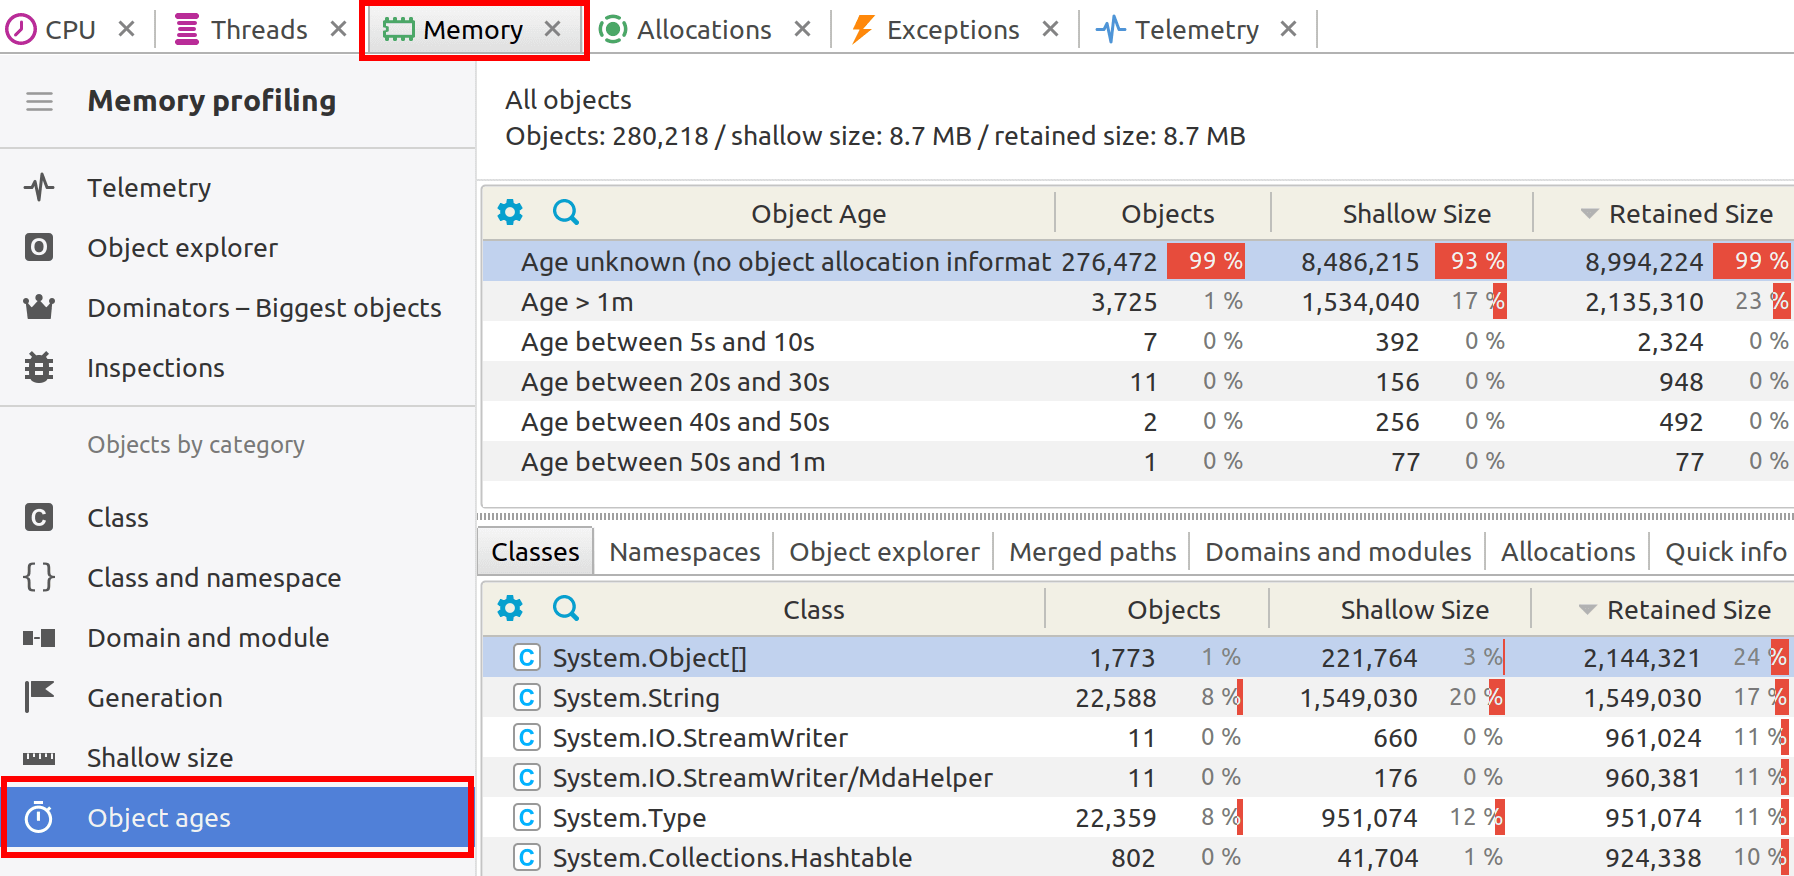
Object ages
Object ages is a feature that tracks and analyzes the lifecycle of objects within a .NET application. Profiler tracks when objects are created and how long they've been alive. This type of information can be useful for diagnosing memory-related problems such as memory leaks and excessive memory usage.
The profiler highlights the objects that have lived for an unusually long time compared to others. This could indicate potential memory leaks or improper object management.
The object ages could potentially show how objects are affecting garbage collection behavior, helping you optimize memory usage and reduce the frequency of garbage collection events.
Objects ages view is available for snapshots that contain recorded object allocations. The recorded objects are grouped according to their lifespans.