- System requirements
- Profiler architecture
- Profiler installation
- Uninstall profiler
- Running the profiler
- Profiler activation
- Welcome screen
- Start profiling
- Profiling overhead
- Snapshots
- Solving performance problems
- CPU profiling
- Thread profiling
- Object allocation profiling
- Memory profiling
- Exception profiling
- Telemetry
- Probes: monitor higher level events
- Inspections: automatic recognition of typical problems
- Automatically trigger actions on event
- Automatic deobfuscation
- Summary, automatic deobfuscation
- Filters
- Profiler command line
- Command line tool to control profiling
- Export of profiling results to external formats
- Profiler .NET API
- Profiler HTTP API
- Settings
- Troubleshooting
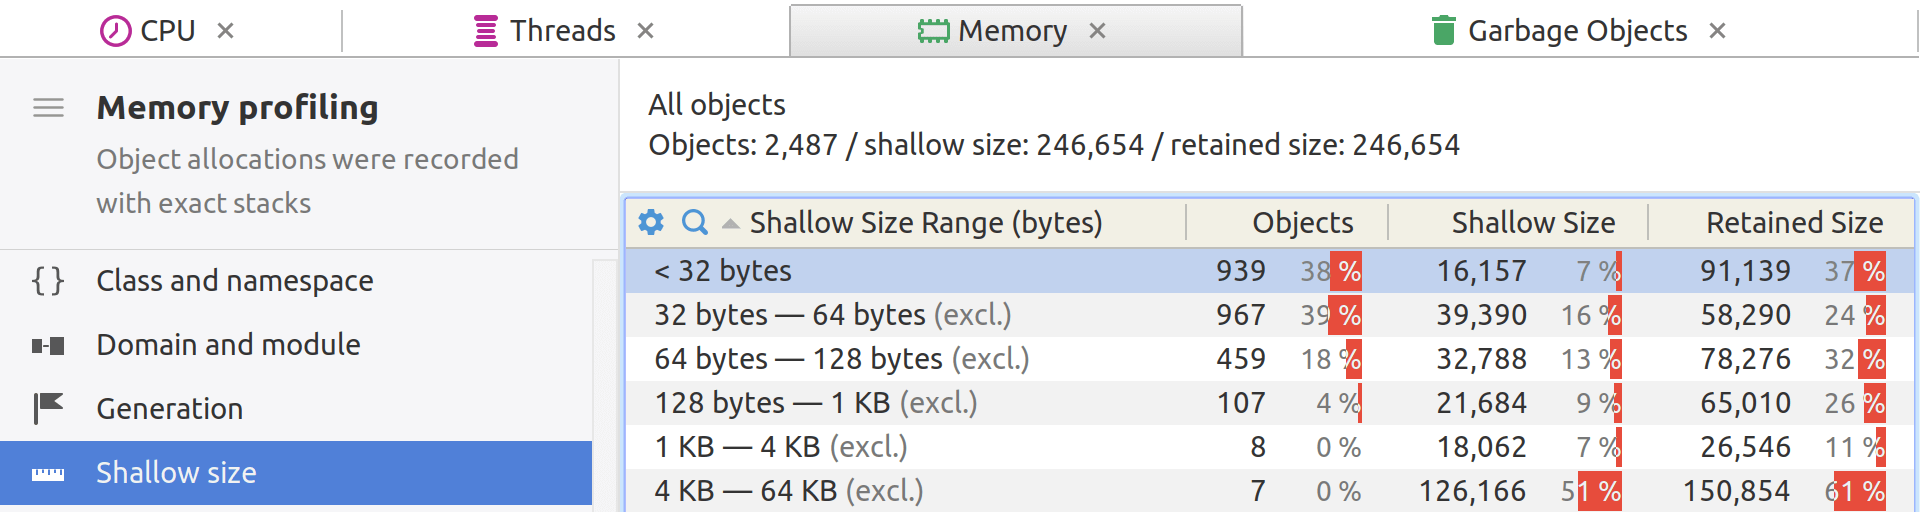
Group objects by shallow size
Analyzing a memory snapshot can be a daunting task, especially when you're dealing with a large .NET application that's potentially leaking memory or using it inefficiently. One useful approach to simplify this analysis is by grouping objects by their shallow size.
Shallow size is the amount of allocated memory that is used to store the object itself, not taking into account any referenced objects. For example, an array object will have a shallow size that includes only the memory used for the array header and the references it contains, not the objects that those references point to.
YourKit .NET Profiler allows you to evaluate how many small, medium and large objects are in the heap, and how much memory they use:
How grouping by shallow size can be used
1. Simplifies analysis: Grouping by shallow size lets you quickly identify types of objects that, individually, take up a lot of space.
2. Identify high memory consumers: Large objects by shallow size are the first suspects when analyzing memory usage. They can either be necessary or signs of memory leaks or inefficiencies.
2. Initial filter: Before delving into deep size analysis (which includes the object and all its dependencies), a shallow size analysis can serve as a first step in pinpointing problem areas.
Best practices
Prioritize by frequency and size
When sorting objects by shallow size, take note of both the individual size and the frequency of objects. Sometimes a large number of small objects can be just as problematic as a small number of large objects.
Focus on your own classes
Standard library classes are generally well-optimized. Your efforts are better spent focusing on classes that you or your team have written.
Review lifecycle
Consider the lifecycle of large objects. Are they being held in memory for longer than needed? Sometimes the issue isn't just size but longevity.
Use multiple metrics
Don't solely rely on shallow size; also consider other metrics like retained size and the number of instances. A full understanding comes from analyzing multiple dimensions.