- System requirements
- Profiler architecture
- Profiler installation
- Uninstall profiler
- Running the profiler
- Profiler activation
- Welcome screen
- Start profiling
- Profiling overhead
- Snapshots
- Solving performance problems
- CPU profiling
- Thread profiling
- Object allocation profiling
- Memory profiling
- Exception profiling
- Telemetry
- Probes: monitor higher level events
- Inspections: automatic recognition of typical problems
- Automatically trigger actions on event
- Automatic deobfuscation
- Summary, automatic deobfuscation
- Filters
- Profiler command line
- Command line tool to control profiling
- Export of profiling results to external formats
- Profiler .NET API
- Profiler HTTP API
- Settings
- Troubleshooting
Leak detection: working with paths
The profiler provides a very powerful way to detect memory leak -
calculation of paths between objects in memory.
A path is a very simple and intuitive concept. A path between Object 1 and Object n
is a sequence of objects where:
- First element is Object 1
- Each element in the sequence, starting with the second one, is referenced from its predecessor
- Last element is Object n
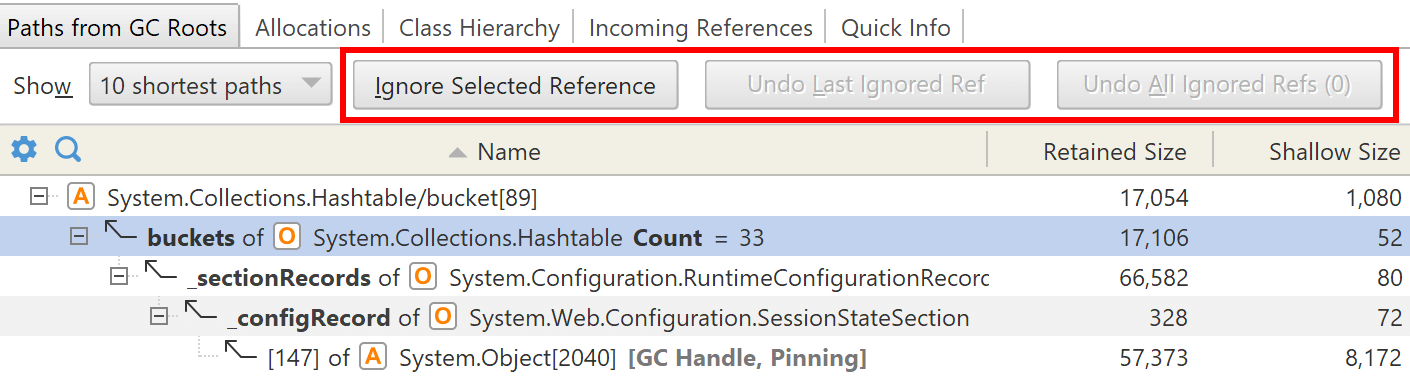
Paths from GC roots
When you have found a leaked object and want to fix the memory leak, use paths from GC roots to find out why that object is retained in memory.
To see the paths, select an object and switch to Paths from GC Roots:
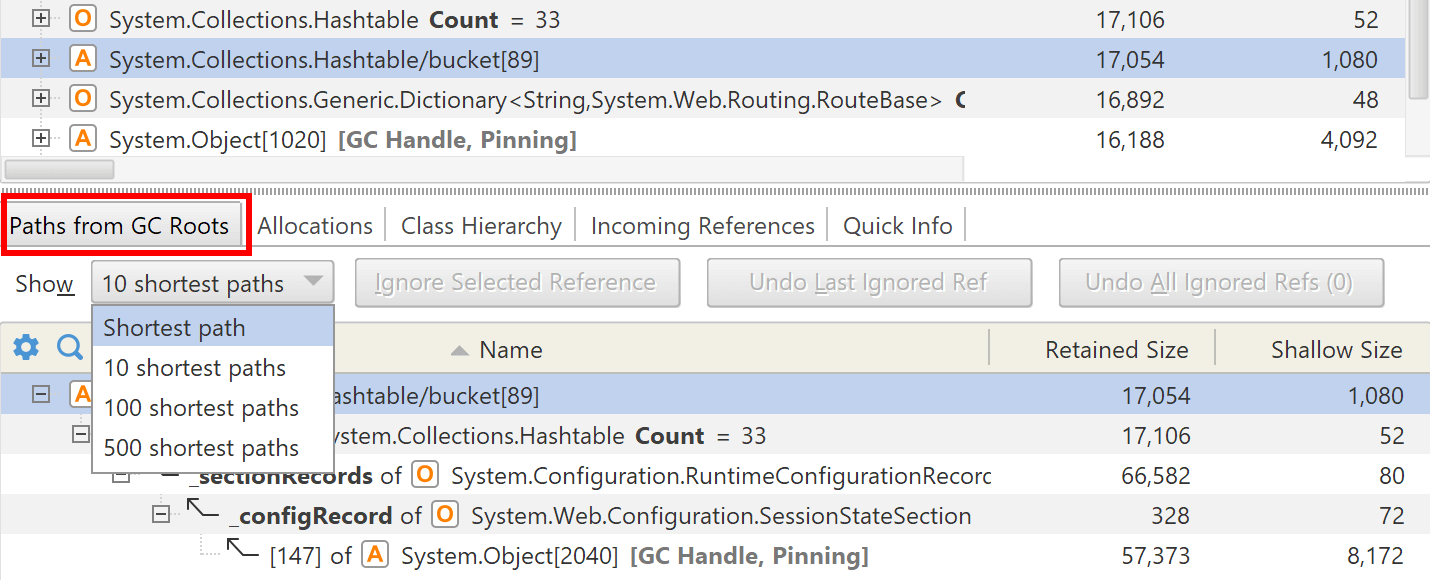
You can limit the number of paths to show. It is guaranteed that the shortest paths are shown first, i.e. there are no paths shorter than the ones displayed.
To open the paths in a new tab use Memory | Paths from GC Roots... (Ctrl+P)
Ignoring particular references
You can ignore particular references in paths. This feature is a great aid when investigating memory leaks, because it immediately shows whether nulling particular reference eliminates the leak, and if not, which remaining references you should also consider.