- System requirements
- Profiler architecture
- Profiler installation
- Uninstall profiler
- Running the profiler
- Profiler activation
- Welcome screen
- Start profiling
- Profiling overhead
- Snapshots
- Solving performance problems
- CPU profiling
- Thread profiling
- Object allocation profiling
- Memory profiling
- Exception profiling
- Telemetry
- Probes: monitor higher level events
- Inspections: automatic recognition of typical problems
- Automatically trigger actions on event
- Automatic deobfuscation
- Summary, automatic deobfuscation
- Filters
- Profiler command line
- Command line tool to control profiling
- Export of profiling results to external formats
- Profiler .NET API
- Profiler HTTP API
- Settings
- Troubleshooting
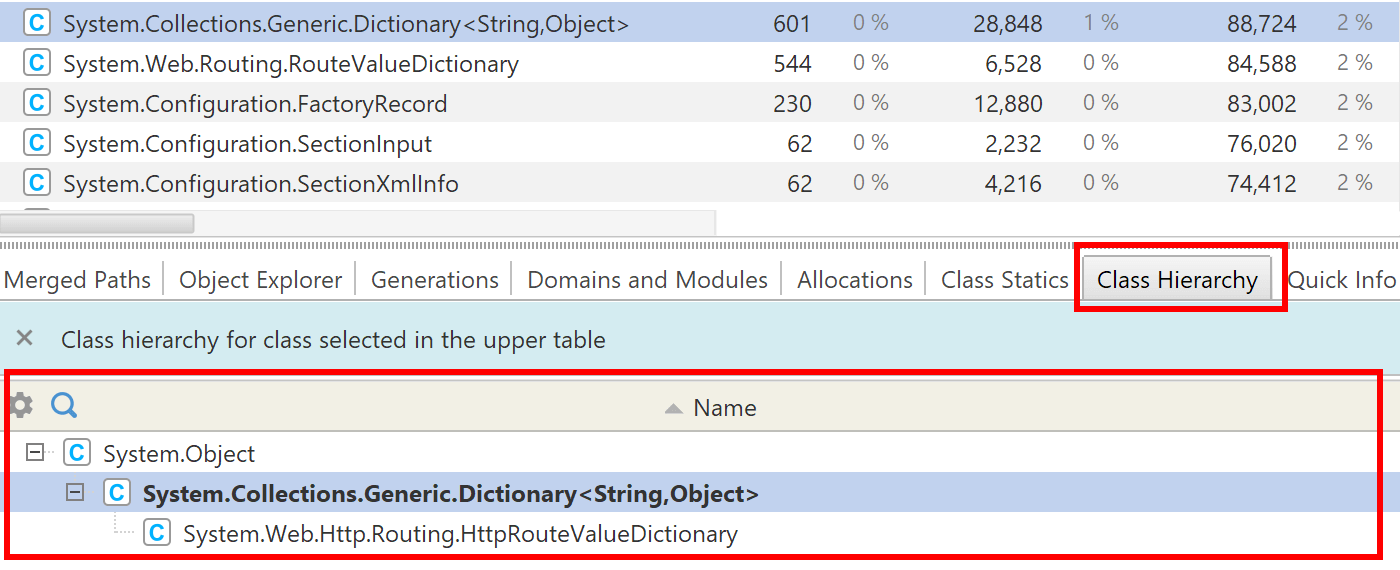
Class hierarchy
Class hierarchy view shows base and derived classes of given class.
The view is available as a dependent view. It is shown for the class selected in the primary table, e.g. in Class list, or for the class of the object selected in the primary table, e.g. in Object explorer.
You may want to open the class in your IDE to use more powerful hierarchy analysis capabilities it provides.