- System requirements
- Profiler architecture
- Profiler installation
- Uninstall profiler
- Running the profiler
- Profiler activation
- Welcome screen
- Start profiling
- Profiling overhead
- Snapshots
- Solving performance problems
- CPU profiling
- Thread profiling
- Virtual threads support
- Object allocation profiling
- Memory profiling
- Monitor profiling
- Exception profiling
- Telemetry
- Probes: monitor events of various kinds
- Inspections: automatic recognition of typical problems
- Automatically trigger actions on event
- Automatic deobfuscation
- Summary
- Filters
- Profiler command line
- Export of profiling results to external formats
- Profiler Java API
- Profiler HTTP API
- Settings
- Troubleshooting and FAQ
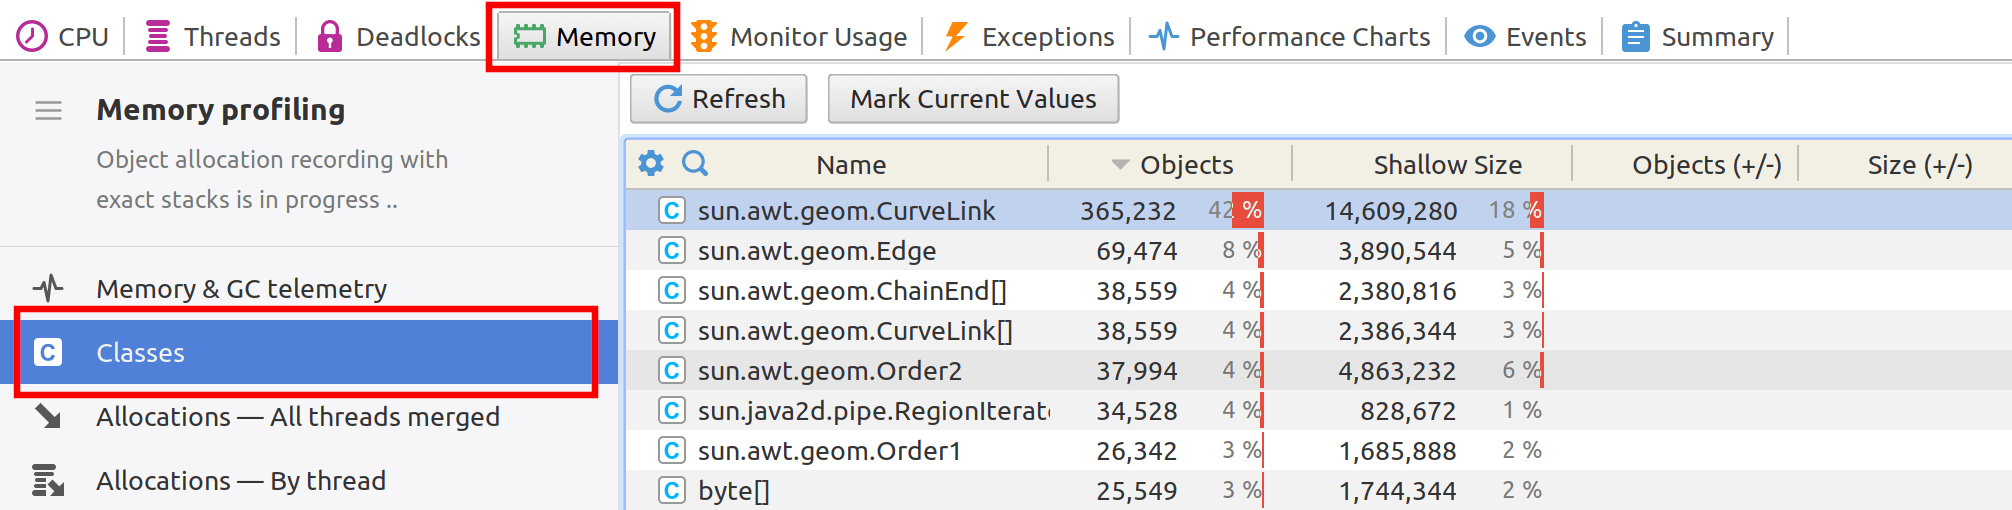
Class instance counts
Classes view shows object counts by class. This view is available when the profiler is connected to a running application, allowing to instantly learn object counts without capturing and opening a memory snapshot.
This view is also available in performance snapshots, but is not available in memory snapshots being superseded with objects view.
The presented information can be useful as an overview of memory consumed by the profiled application and also as a clue to detecting memory leaks. For details, see How to find out why application eats that much memory? and How to find memory leaks?
This view, unlike other telemetry views, does not automatically periodically update. This is for performance considerations: gathering the statistics may take significant time in case of huge heaps with many objects, thus should run on demand.
Instead, it updates when:
- Refresh button is pressed when the tab is visible (an explicit update)
- Force Garbage Collector button is pressed when the tab is visible (it makes sense to immediately see the changes in object counts and sizes after forcing garbage collection)
- a snapshot is captured (gathering the statistics is a part of the capture)