- System requirements
- Profiler architecture
- Profiler installation
- Uninstall profiler
- Running the profiler
- Profiler activation
- Welcome screen
- Start profiling
- Profiling overhead
- Snapshots
- Solving performance problems
- CPU profiling
- Thread profiling
- Virtual threads support
- Object allocation profiling
- Memory profiling
- Monitor profiling
- Exception profiling
- Telemetry
- Probes: monitor events of various kinds
- Inspections: automatic recognition of typical problems
- Automatically trigger actions on event
- Automatic deobfuscation
- Summary
- Filters
- Profiler command line
- Export of profiling results to external formats
- Profiler Java API
- Profiler HTTP API
- Settings
- Troubleshooting and FAQ
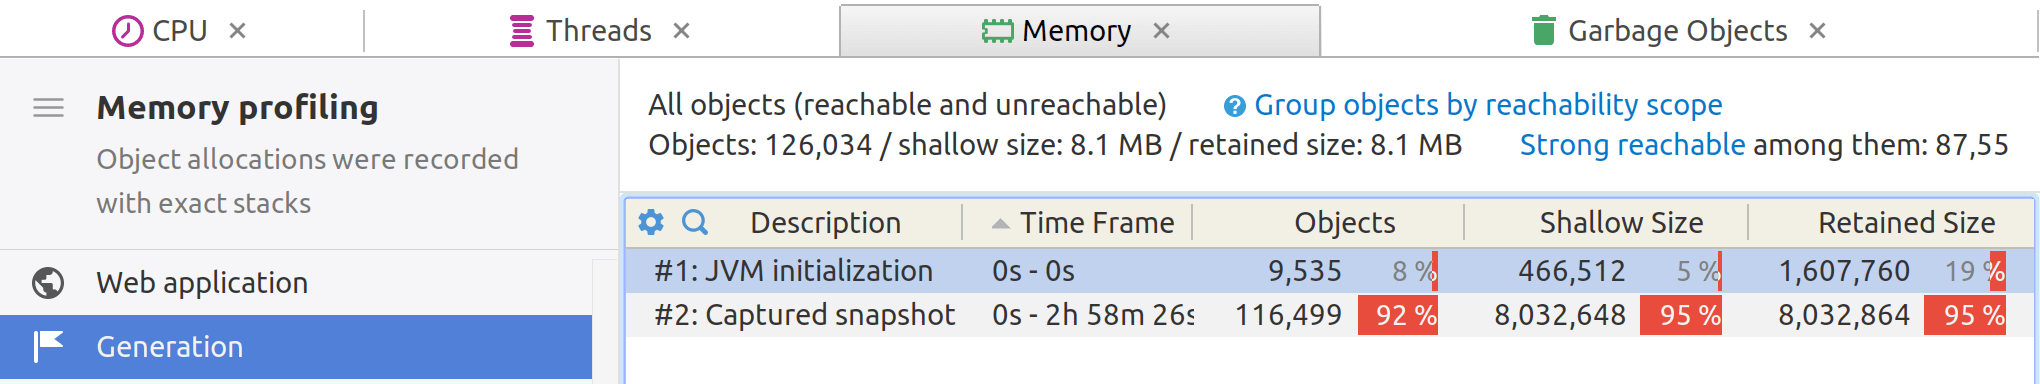
Group objects by generation
When it comes to optimizing Java applications, an in-depth analysis of
memory utilization is critical.
One advanced technique is to group objects by their generations.
The generations are sequentially numbered starting from 1.
When an object is created, it is associated with the current generation number.
The generation number is automatically advanced on capturing memory snapshot.
You can also advance current generation by using
Advance Object Generation Number
toolbar button
 ,
or by using profiler HTTP API, or with
help of triggers.
An object's age is denoted by its generation: the lower the generation number,
the older the object is.
,
or by using profiler HTTP API, or with
help of triggers.
An object's age is denoted by its generation: the lower the generation number,
the older the object is.
How object generations can be used when optimizing Java applications
1. Identify memory leaks: Grouping objects by their generations allows you to track down objects that have been in memory for longer than necessary, which might indicate a memory leak.
2. Optimize object lifespan: When you can see how long objects are staying in memory, you can tune the lifespan of those objects accordingly, ensuring that they are garbage collected at the appropriate time.
3. Focus on short-lived objects: Pay special attention to objects with short lifetimes, as they should ideally be short-lived and subject to efficient garbage collection. Prolonged existence of short-lived objects can indicate memory leaks.
4. Segmentation by time intervals: Divide the application's lifecycle into meaningful time intervals (e.g., startup, steady-state, peak load) to analyze memory usage variations over different phases.
5. Cache strategy improvements: You can fine-tune your cache eviction policies based on object generations to improve application speed and reduce memory consumption.