- System requirements
- Profiler architecture
- Profiler installation
- Uninstall profiler
- Running the profiler
- Profiler activation
- Welcome screen
- Start profiling
- Profiling overhead
- Snapshots
- Solving performance problems
- CPU profiling
- Thread profiling
- Virtual threads support
- Object allocation profiling
- Memory profiling
- Monitor profiling
- Exception profiling
- Telemetry
- Probes: monitor events of various kinds
- Inspections: automatic recognition of typical problems
- Automatically trigger actions on event
- Automatic deobfuscation
- Summary
- Filters
- Profiler command line
- Export of profiling results to external formats
- Profiler Java API
- Profiler HTTP API
- Settings
- Troubleshooting and FAQ
Dominators - Biggest objects
What is a dominator in the Java objects graph?
In the context of Java memory profiling, the term dominator is used to describe a node in an object graph that has an exclusive ownership or control over another node. In other words, a node A is said to dominate another node B if all paths from the GC root node of the object graph to node B must pass through node A. Understanding dominators can be crucial in diagnosing and resolving memory issues, such as leaks.
The concept of dominators is used to model and analyze the relationships between objects in memory. Java objects form a directed graph, where the edges represent references between objects. This graph helps developers identify how objects are connected and provides insights into how memory is being utilized.
Importance of dominators in memory profiling
Dominators play a significant role in memory profiling for several reasons:
1. Identifying key memory consumers: By analyzing dominators, you can pinpoint the objects that are holding references to a significant portion of the application's memory. This allows for targeted optimization and cleanup efforts.
2. Root cause analysis: In cases where there is excessive memory usage or leaks, dominators can help in tracing the objects that are preventing garbage collection, and consequently identify the root cause.
Using dominators to find memory leaks
1. Capture a memory snapshot: The first step is to capture memory snapshot of the Java application using YourKit Java Profiler. This provides a snapshot of all objects and their references.
2. Analyze the dominator tree: Load the memory snapshot into YourKit Java Profiler, and select Dominators - Biggest objects on Memory tab. This view shows the dominators with the biggest retained size.
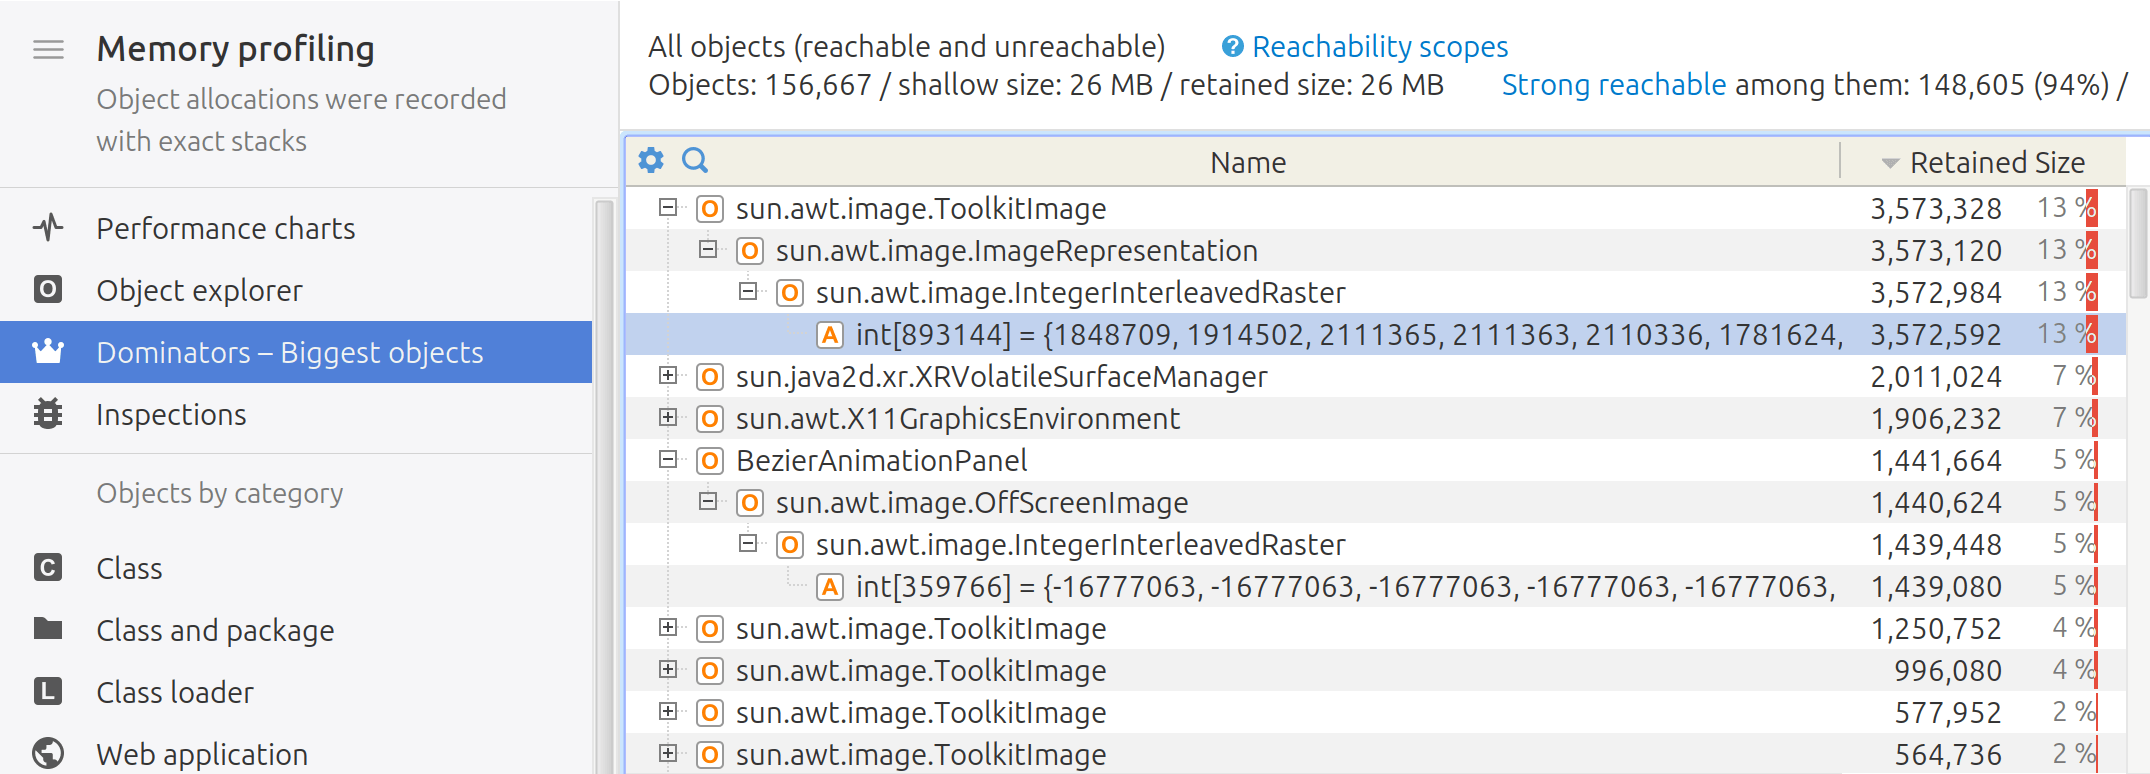
3. Identify potential leaks: Look for objects that have a disproportionately high retained size (memory retained by an object and all objects it dominates). These objects are potential sources of memory leaks.
4. Inspect references: Examine the references to and from the suspected objects, and determine if they are held longer than necessary.
5. Verify with code: After identifying the potential leaks, verify them in the application code and rectify the issues causing the leak.