- System requirements
- Profiler architecture
- Profiler installation
- Uninstall profiler
- Running the profiler
- Profiler activation
- Welcome screen
- Start profiling
- Profiling overhead
- Snapshots
- Solving performance problems
- CPU profiling
- Thread profiling
- Virtual threads support
- Object allocation profiling
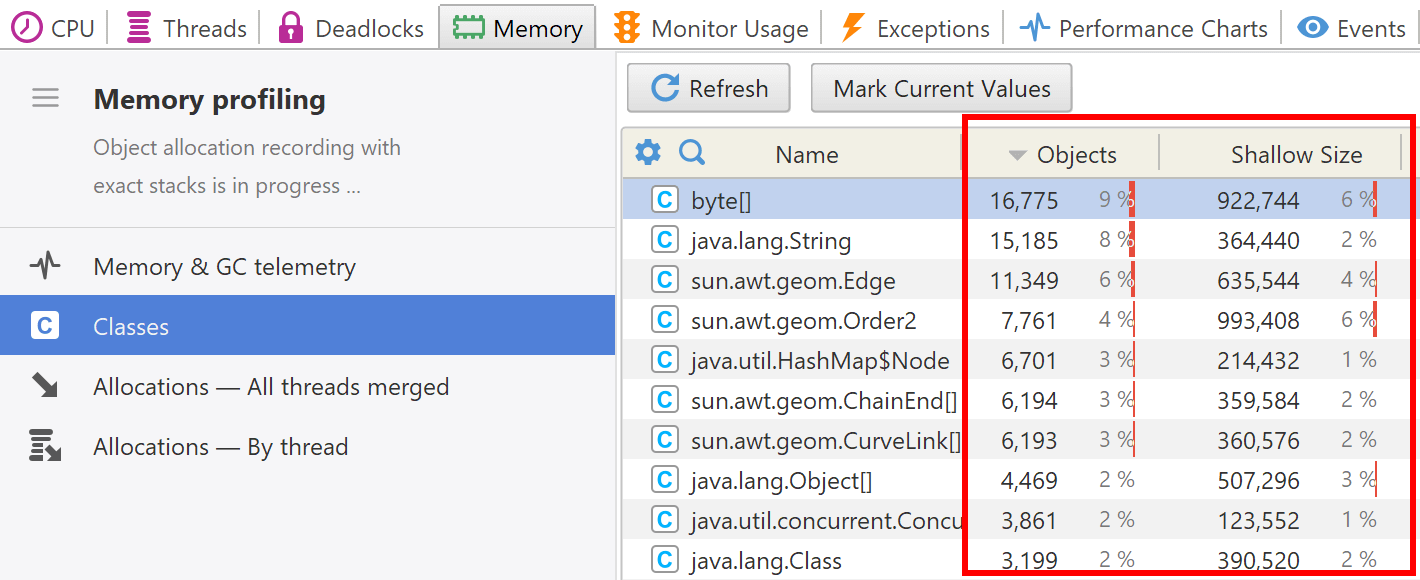
- Memory profiling
- Monitor profiling
- Exception profiling
- Telemetry
- Probes: monitor events of various kinds
- Inspections: automatic recognition of typical problems
- Automatically trigger actions on event
- Automatic deobfuscation
- Summary
- Filters
- Profiler command line
- Export of profiling results to external formats
- Profiler Java API
- Profiler HTTP API
- Settings
- Troubleshooting and FAQ
JVM memory structure
As experience has shown, sometimes a sort of uncertainty may arise on the subject of Java Virtual Machine (JVM) memory structure and other related aspects such as sizes of various kinds of memory, live and dead objects, etc. In this article, we shall try to illuminate these issues to clear up the point.
- Heap and non-heap memory
- Heap memory
- Non-heap memory
- Allocated and used memory
- Live and dead objects
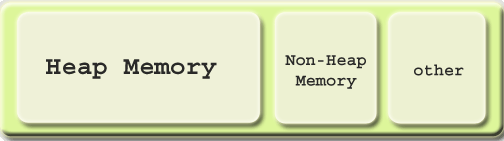
Heap and non-heap memory
The JVM memory consists of the following segments:
- Heap Memory, which is the storage for Java objects.
- Non-Heap Memory, which is used by Java to store loaded classes and other meta-data.
- JVM code itself, JVM internal structures, loaded profiler agent code and data, etc.
Heap memory
The JVM has a heap that is the runtime data area from which memory for all class instances and arrays are allocated. It is created at the JVM start-up.
The heap size may be configured with the following VM options:
-
-Xmx<size>- to set the maximum Java heap size. -
-Xms<size>- to set the initial Java heap size.
Heap memory for objects is reclaimed by an automatic memory management system which is known as a garbage collector. The heap may be of a fixed size or may be expanded and shrunk, depending on the garbage collector's strategy.
Non-heap memory
Also, the JVM has memory other than the heap, referred to as non-heap memory. It is created at the JVM startup and stores per-class structures such as runtime constant pool, field and method data, and the code for methods and constructors, as well as interned Strings.
Unfortunately, the only information JVM provides on non-heap memory is its overall size. No detailed information on non-heap memory content is available.
The abnormal growth of non-heap memory size may indicate a potential problem, in this case you may check up the following:
- If there are class loading issues such as leaked loaders. In this case, the problem may be solved with the help of Class loaders view.
- If there are strings being massively interned. For detection of such problem, Object allocation profiling may be used.
If the application indeed needs that much of non-heap memory,
you may enlarge the maximum size with the help of -XX:MaxPermSize VM option.
For example, -XX:MaxPermSize=128m sets the size of 128 Mb.
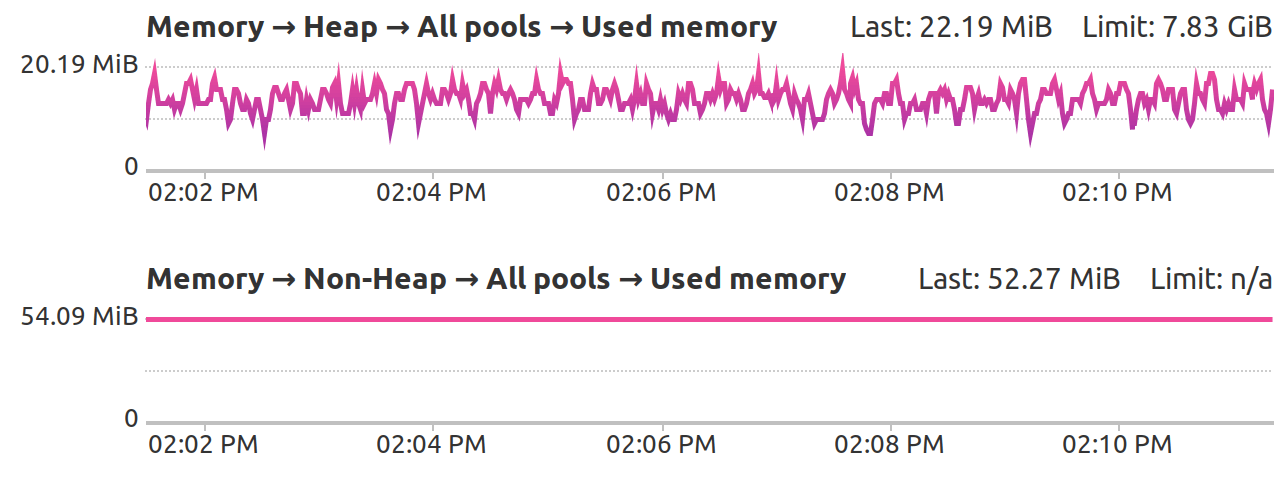
Heap and non-heap memory usage is shown in the memory telemetry charts:
Allocated and used memory
The allocated memory is an overall amount of memory allocated by the JVM, while used memory is the amount of memory which is actually in use. Obviously, the allocated memory cannot be less than the used memory. The exact amount of allocated memory is determined by the JVM internal strategies.
Live and dead objects
Used heap memory consists of live and dead objects.
Live objects are accessible by the application and will not be a subject of garbage collection.
Dead objects are those which will never be accessible by the application but have not been collected yet by the garbage collector. Such objects occupy the heap memory space until they are eventually collected by the garbage collector.
Note that Class list view in
memory telemetry shows both live and dead objects.
You may observe the decreasing number of objects when
garbage collection occurs automatically,
or with the help of
 Force Garbage Collection toolbar button.