- System requirements
- Profiler architecture
- Profiler installation
- Uninstall profiler
- Running the profiler
- Profiler activation
- Welcome screen
- Start profiling
- IDE integration
- Visual Studio
- Rider
- Profile .NET executable
- Profile ASP.NET application in IIS
- Profile ASP.NET web app on Azure App Service on Linux
- Profile ASP.NET web app on Azure App Service on Windows
- Profile all .NET processes that will start
- Attach profiler to a running application
- Profile remote applications
- Profiling in Docker container
- Manually enable profiling of local applications
- Agent startup options
- Connect to profiled application
- Profiling overhead
- Snapshots
- Solving performance problems
- CPU profiling
- Thread profiling
- Object allocation profiling
- Memory profiling
- Exception profiling
- Telemetry
- Probes: monitor higher level events
- Inspections: automatic recognition of typical problems
- Automatically trigger actions on event
- Automatic deobfuscation
- Summary, automatic deobfuscation
- Filters
- Profiler command line
- Command line tool to control profiling
- Export of profiling results to external formats
- Profiler .NET API
- Profiler HTTP API
- Settings
- Troubleshooting
Visual Studio
YourKit .NET Profiler has integration with Visual Studio 2017 - 2022.
Plugin installation
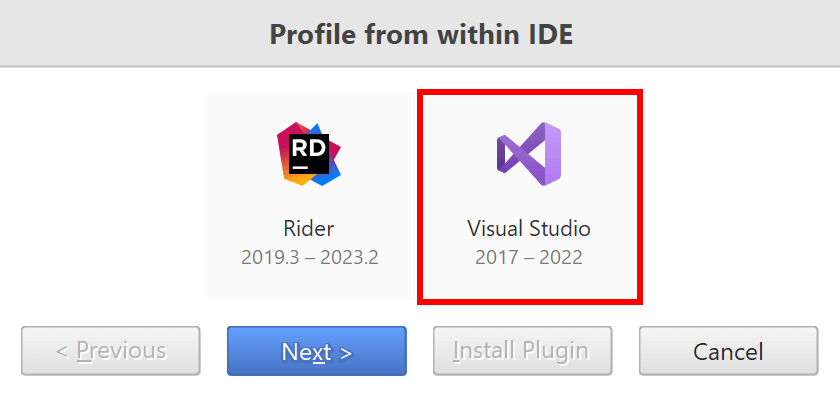
To enable integration, you should install the profiler plugin. Use Profile from within the IDE... action on Welcome screen or in Tools menu, select Visual Studio and follow the instructions.
Profiling from Visual Studio
After the plugin is installed, the Profile action is added to the main toolbar.
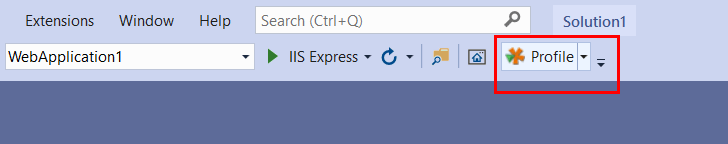
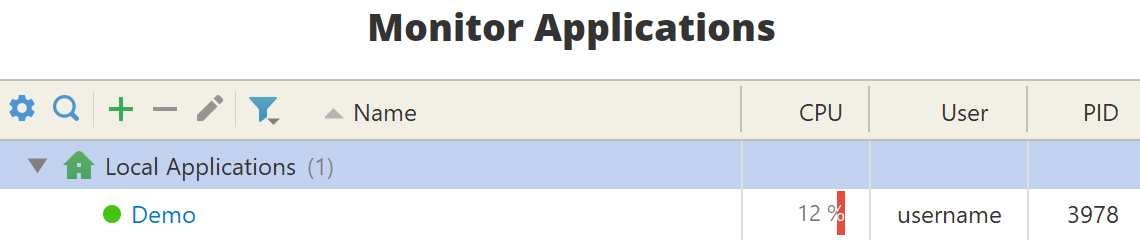
The Profile action starts the profiled application, and connects to it from the profiler UI. Furthermore, the application will appear in Monitor Applications list on Welcome screen.
Navigation action
While profiling, you usually need to browse to the related source code to understand the root of a performance problem. When it is found and located, you edit the source code to fix it.
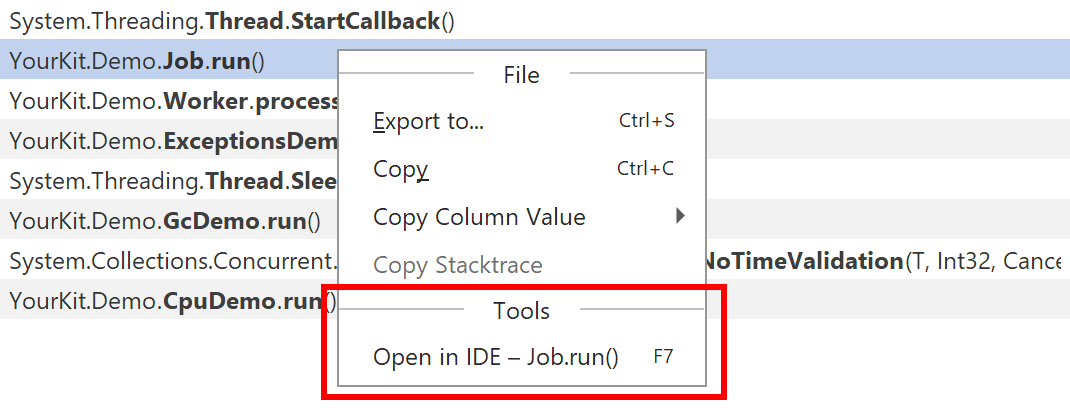
Use Tools | Open in IDE (F7) to open the underlying source code in the editor of your IDE - the best place to browse and edit code.
This navigation action always works on the current selection and is available in both CPU and memory views.