- System requirements
- Profiler architecture
- Profiler installation
- Uninstall profiler
- Running the profiler
- Profiler activation
- Welcome screen
- Start profiling
- IDE integration
- Profile .NET executable
- Profile ASP.NET application in IIS
- Profile ASP.NET web app on Azure App Service on Linux
- Profile ASP.NET web app on Azure App Service on Windows
- Profile all .NET processes that will start
- Attach profiler to a running application
- Profile remote applications
- Profiling in Docker container
- Manually enable profiling of local applications
- Agent startup options
- Connect to profiled application
- Profiling overhead
- Snapshots
- Solving performance problems
- CPU profiling
- Thread profiling
- Object allocation profiling
- Memory profiling
- Exception profiling
- Telemetry
- Probes: monitor higher level events
- Inspections: automatic recognition of typical problems
- Automatically trigger actions on event
- Automatic deobfuscation
- Summary, automatic deobfuscation
- Filters
- Profiler command line
- Command line tool to control profiling
- Export of profiling results to external formats
- Profiler .NET API
- Profiler HTTP API
- Settings
- Troubleshooting
Profile ASP.NET web app on Azure App Service on Windows
This article describes how to set up profiling of ASP.NET web app in a Windows container running on Azure App Service.
YourKit Connection Broker setup
We will use YourKit Connection Broker as a middleware, which helps to establish connection between profiler UI and the profiler agent running on the cloud.
This is a step-by-step instruction how to sign-up YourKit Connection Broker account. All preparations should not take more than 5 minutes. You need to create a security zone and access token to it.
In this example:
-
The connection broker has
https://cloud.yourkit.comaddress. The real broker address is the cloud region address of the security zone. -
The access token to the
security zone is
mytoken. The real token you have just created on the first YourKit Connection Broker setup step.
Download profiler to the container
Select your application in the Azure App Service portal. In the left navigation, select Console under Development Tools section.
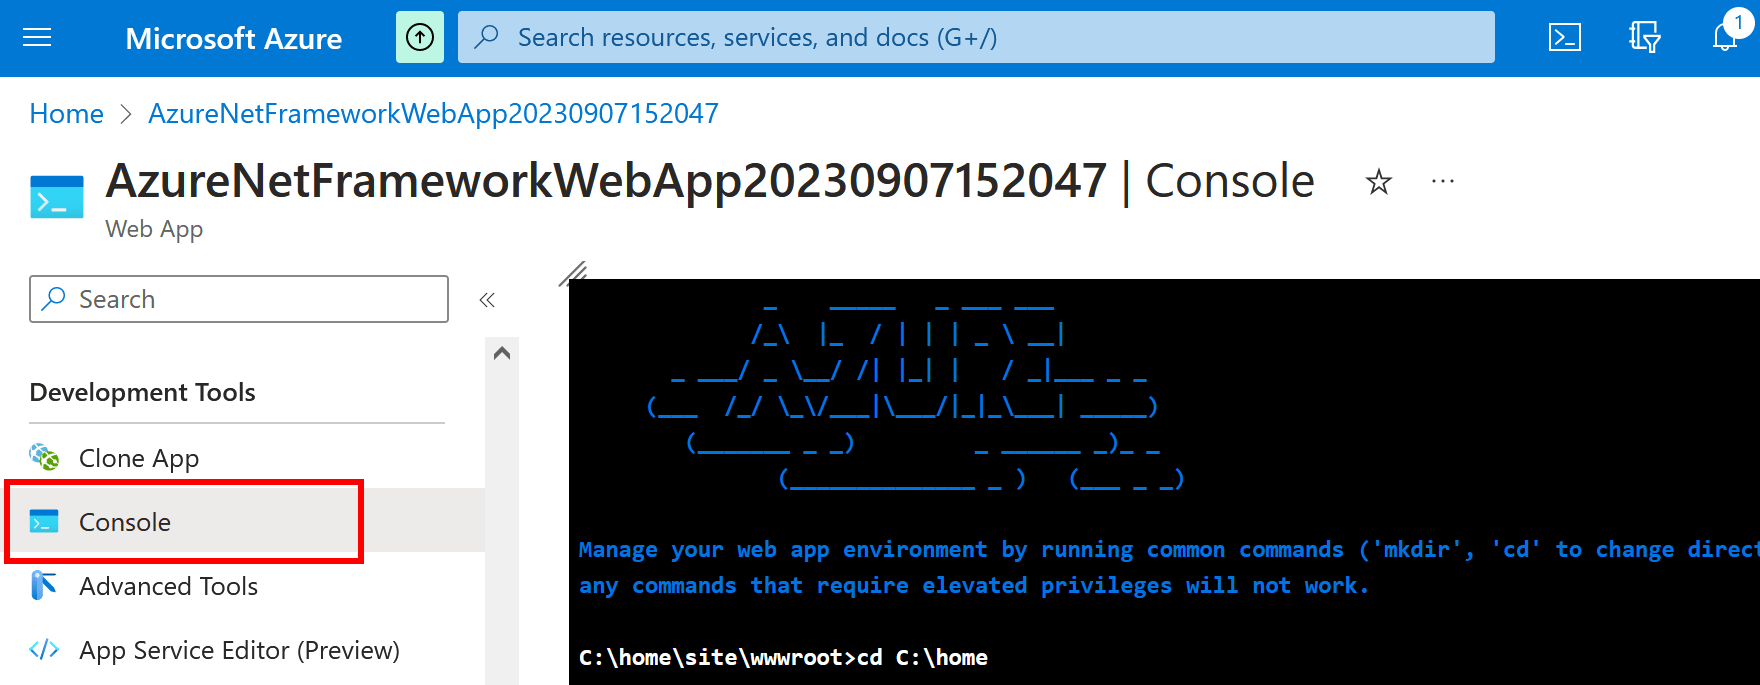
We need the profiler agent to be available in a persistent location.
Let's download and unpack it to the C:\home directory.
To do this, type the following commands in the console.
cd /d C:\home
curl -fLOSs https://www.yourkit.com/dotnet-profiler/download/docker/YourKit-NetProfiler-2025.3-docker.zip
unzip -o YourKit-NetProfiler-2025.3-docker.zip
Enable profiling in the Azure portal
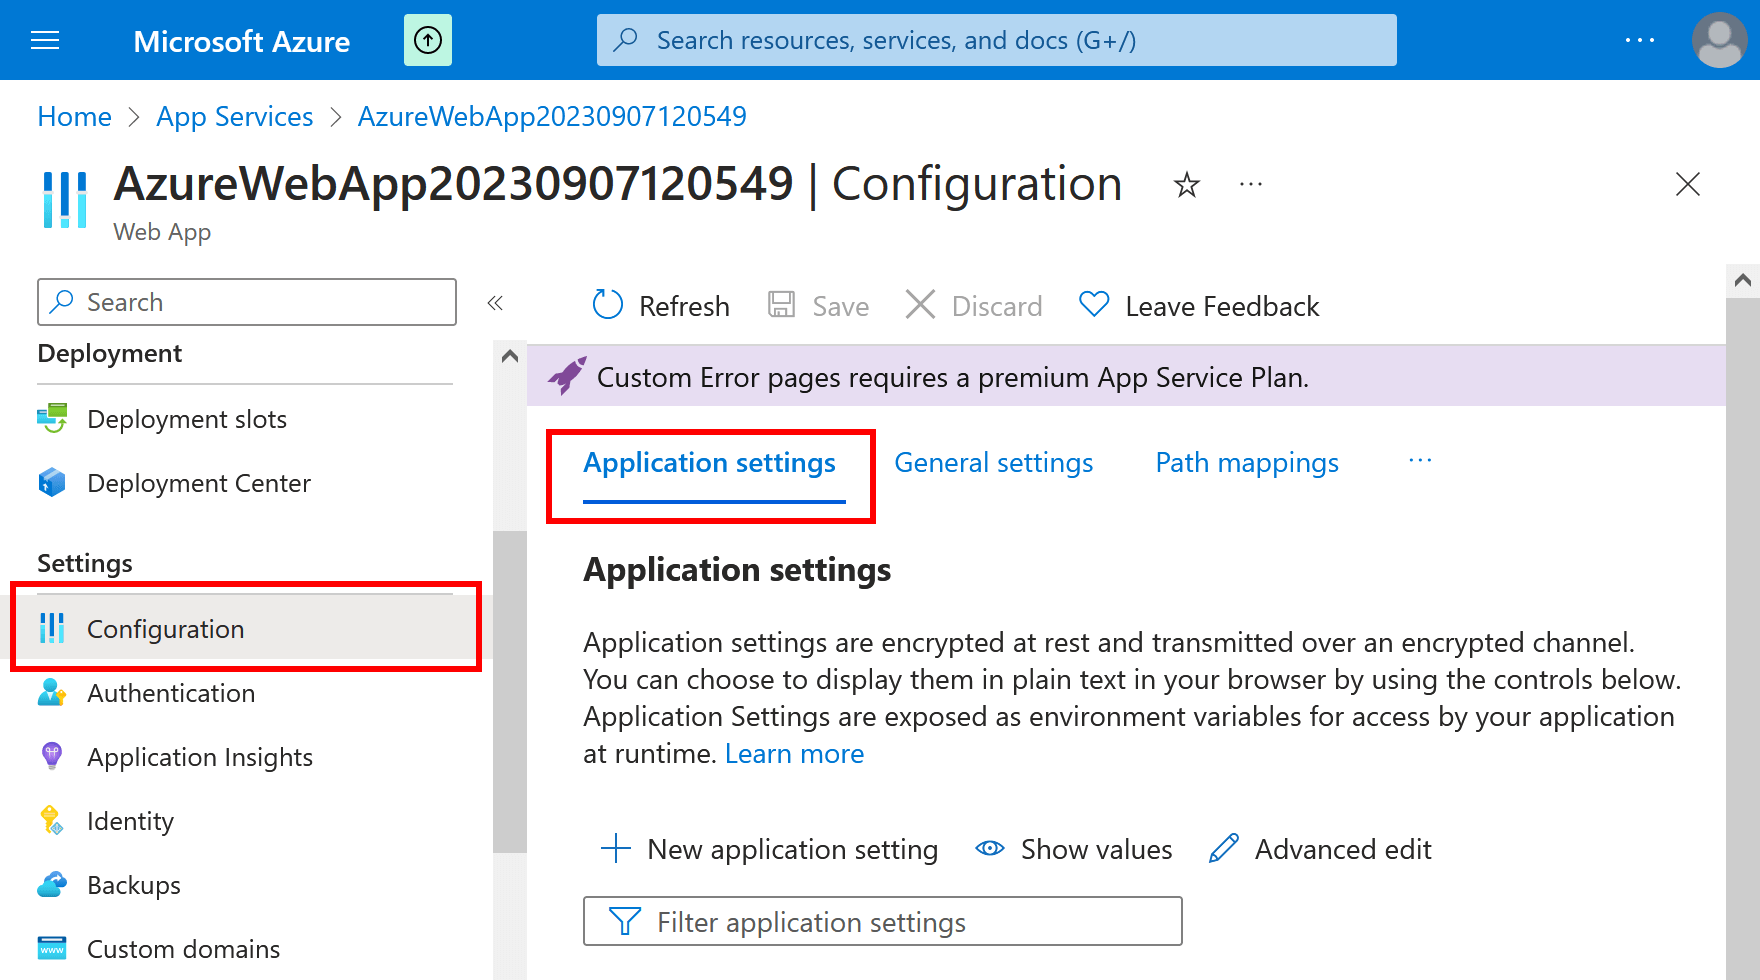
In the app's left menu, select Configuration > Application settings.
To be able to capture snapshots and analyze them after container restarts,
we'll set a writeable and persistent snapshot directory C:\home\snapshots with the startup option
dir.
To enable profiling we need to add the following settings. Make sure to enter correct agent path and broker settings.
| Name | Value |
| YNP_STARTUP_OPTIONS | broker_url=https://cloud.yourkit.com,broker_token=mytoken,dir=C:\home\snapshots |
| Enable profiling of ASP.NET Core apps | |
| CORECLR_ENABLE_PROFILING | 1 |
| CORECLR_PROFILER | {E5A4ADC4-C749-400D-B066-6AC8C1D3790A} |
| CORECLR_PROFILER_PATH_64 | C:\home\YourKit-NetProfiler\bin\windows-x86-64\ynpagent.dll |
| CORECLR_PROFILER_PATH_32 | C:\home\YourKit-NetProfiler\bin\windows-x86-32\ynpagent.dll |
| Enable profiling of ASP.NET Framework apps | |
| COR_ENABLE_PROFILING | 1 |
| COR_PROFILER | {E5A4ADC4-C749-400D-B066-6AC8C1D3790A} |
| COR_PROFILER_PATH_64 | C:\home\YourKit-NetProfiler\bin\windows-x86-64\ynpagent.dll |
| COR_PROFILER_PATH_32 | C:\home\YourKit-NetProfiler\bin\windows-x86-32\ynpagent.dll |
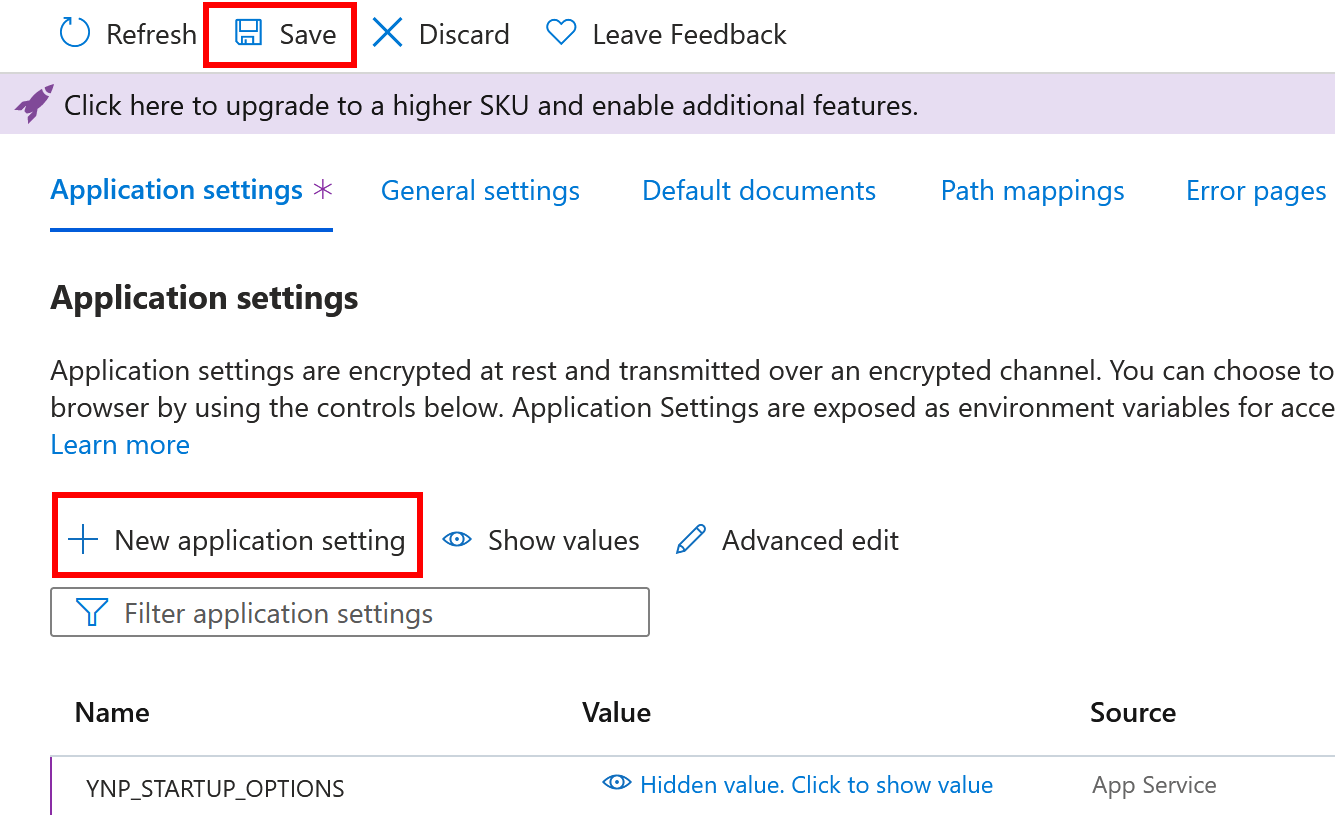
To add a new app setting, click New application setting. After new settings are saved application should restart with profiling enabled.
Connect to the profiled application from the UI
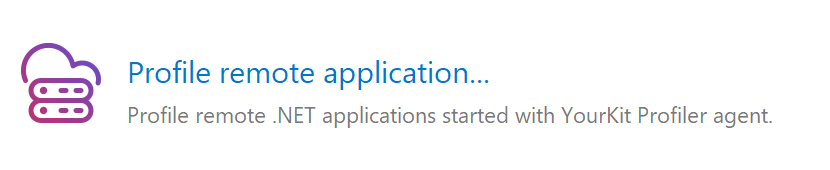
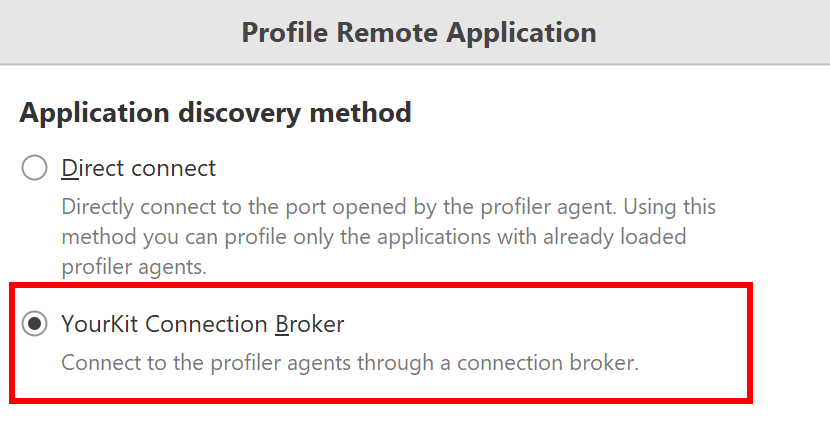
Use Profile remote application... action on Welcome screen or in Profile menu.
Choose the YourKit Connection Broker discovery method.
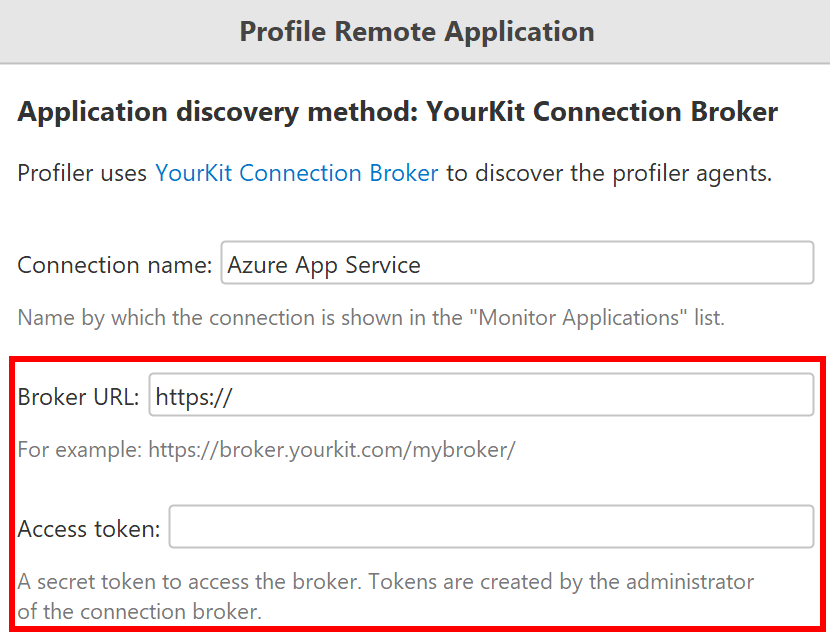
Provide broker URL and broker access token in the corresponding fields.
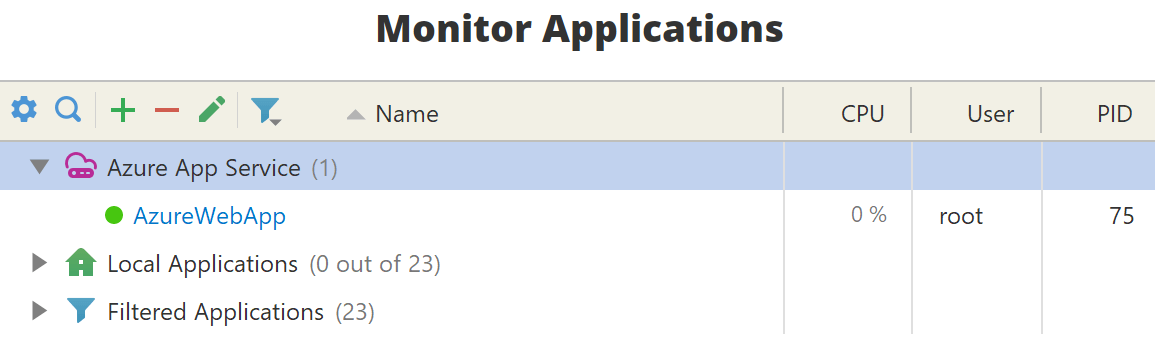
Created connection will appear in the Monitor Applications list on Welcome screen.
Open ASP.NET application in a browser to make sure .NET runtime is loaded. Profiled application will appear in the list, from which you can click on it to connect.
Stop profiling
To disable profiling, set CORECLR_ENABLE_PROFILING and COR_ENABLE_PROFILING
application setting values to 0. Alternatively, remove all settings added on previous steps.