- System requirements
- Profiler architecture
- Profiler installation
- Uninstall profiler
- Running the profiler
- Profiler activation
- Welcome screen
- Start profiling
- IDE integration
- Profile .NET executable
- Profile ASP.NET application in IIS
- Profile ASP.NET web app on Azure App Service on Linux
- Profile ASP.NET web app on Azure App Service on Windows
- Profile all .NET processes that will start
- Attach profiler to a running application
- Profile remote applications
- Profiling in Docker container
- Manually enable profiling of local applications
- Agent startup options
- Connect to profiled application
- Profiling overhead
- Snapshots
- Solving performance problems
- CPU profiling
- Thread profiling
- Object allocation profiling
- Memory profiling
- Exception profiling
- Telemetry
- Probes: monitor higher level events
- Inspections: automatic recognition of typical problems
- Automatically trigger actions on event
- Automatic deobfuscation
- Summary, automatic deobfuscation
- Filters
- Profiler command line
- Command line tool to control profiling
- Export of profiling results to external formats
- Profiler .NET API
- Profiler HTTP API
- Settings
- Troubleshooting
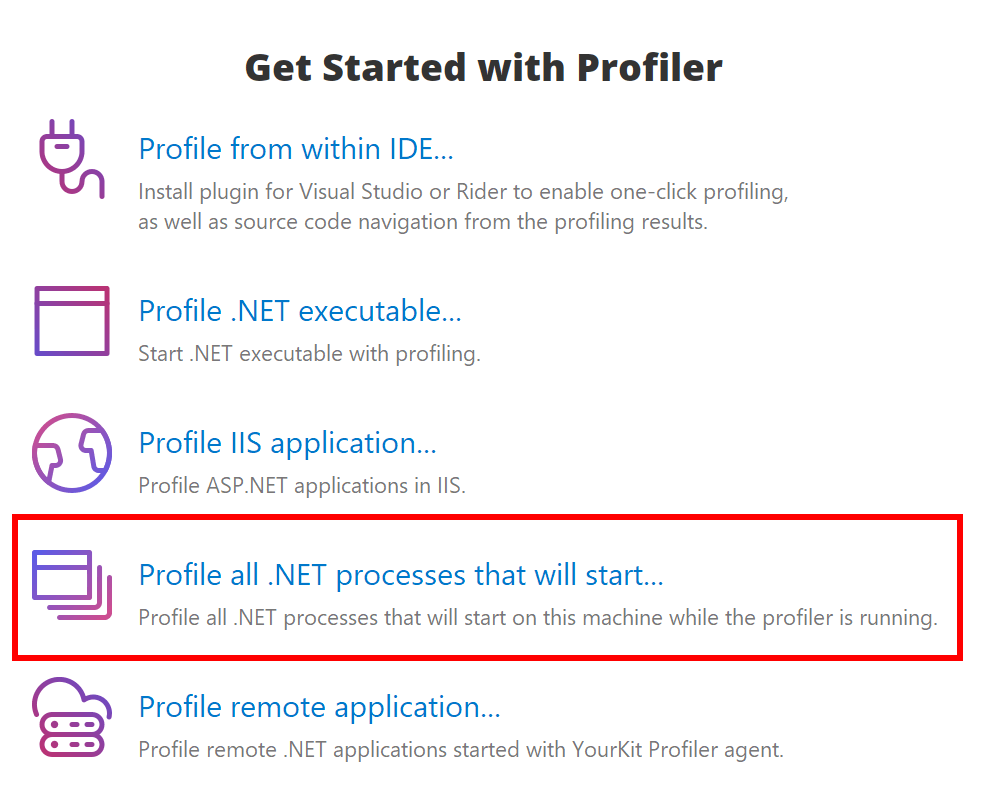
Profile all .NET processes that will start
The following describes profiling of local applications which start indirectly. For example: services, processed are spawned by other processes, etc. This action is available only on Windows. If the application executable can be explicitly launched, profile it as a .NET executable instead.
1. Use Profile all .NET processes that will start... action on Welcome screen or in Profile menu.
2. In the appeared dialog you can configure CPU profiling mode, enable object allocation profiling and events, and set any profiling option:
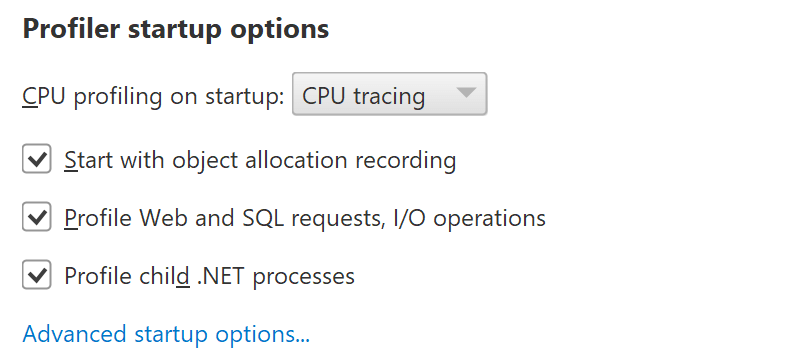
3. Choose profiling options and press Profile button.
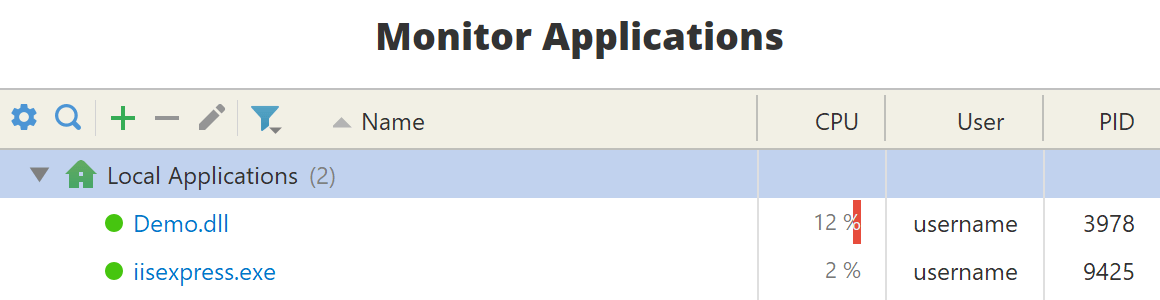
4. Start the application which you want to profile. It will appear on the Welcome screen in Monitor Applications list, from which you can click on it to connect.
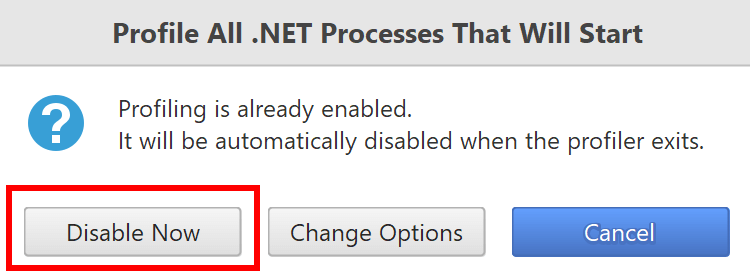
Turning off the profiling
Profiling will be automatically disabled when the profiler exits, and automatically enabled when the profiler starts again.
To permanently switch it off, invoke the action again and press 'Disable Now':