- System requirements
- Profiler architecture
- Profiler installation
- Uninstall profiler
- Running the profiler
- Profiler activation
- Welcome screen
- Start profiling
- Profiling overhead
- Snapshots
- Solving performance problems
- Performance bottlenecks
- Optimizing memory usage
- Memory leaks
- Excessive garbage allocation
- Out of memory error (OutOfMemoryError and -XX:+HeapDumpOnOutOfMemoryError)
- Solving 'java.lang.OutOfMemoryError: PermGen space' error
- CPU profiling
- Thread profiling
- Virtual threads support
- Object allocation profiling
- Memory profiling
- Monitor profiling
- Exception profiling
- Telemetry
- Probes: monitor events of various kinds
- Inspections: automatic recognition of typical problems
- Automatically trigger actions on event
- Automatic deobfuscation
- Summary
- Filters
- Profiler command line
- Export of profiling results to external formats
- Profiler Java API
- Profiler HTTP API
- Settings
- Troubleshooting and FAQ
Out of memory error (OutOfMemoryError and -XX:+HeapDumpOnOutOfMemoryError)
You can capture HPROF snapshot right when your Java
application crashes due to an OutOfMemoryError
by adding the following JVM argument before starting your application:
-XX:+HeapDumpOnOutOfMemoryError -XX:HeapDumpPath=/path/to/dump/file.hprof
HPROF memory snapshot will be captured automatically on
first OutOfMemoryError,
if the profiled application runs on Oracle JDK or OpenJDK HotSpot.
The OutOfMemoryError snapshots are captured by
JVM's built-in heap dumper, which is disabled by default.
JVM option -XX:+HeapDumpOnOutOfMemoryError enables it.
However, you do not need to specify this option when
profiling your applications,
because YourKit Java Profiler agent programmatically enables
the dumper upon profiled application startup
or when the agent is attached to a running application.
Enabling the dumper is safe and adds absolutely no overhead.
Technically, enabling is simply setting the state of a boolean flag.
When the first OutOfMemoryError occurs, the JVM
dumps the heap to file if the flag is true.
Anyway, if for some reason you want not to enable the dumper,
specify disable_oome_dumper startup option.
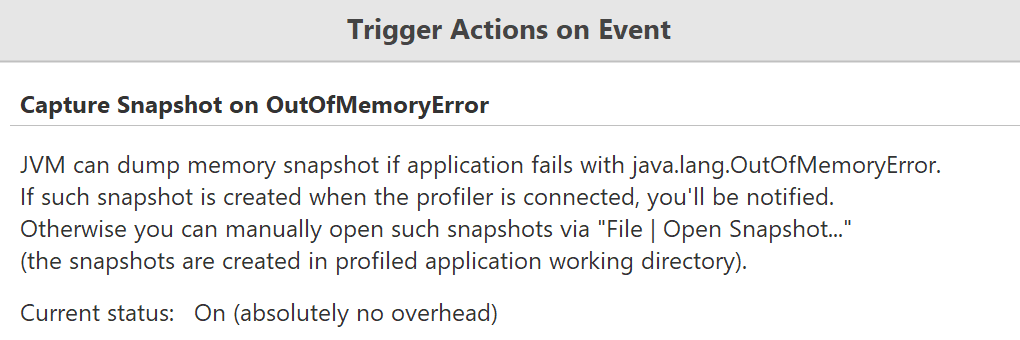
To check the status, connect to the profiled application
and click  toolbar button.
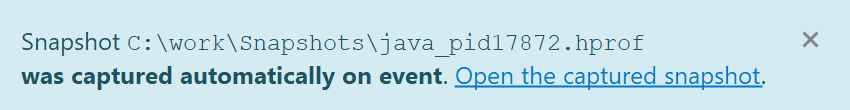
The profiler shows the following notification when a snapshot is captured on OutOfMemoryError.
Please note that this approach has several benefits over the capturing snapshot on high memory usage feature, because it uses the JVM's internal lightweight dumping algorithm. This algorithm is specially designed to work in low memory conditions, where the JVM general purpose profiling interface JVMTI used by profilers may fail due to low resources.
See also Support of HPROF format snapshots.