- System requirements
- Profiler architecture
- Profiler installation
- Uninstall profiler
- Running the profiler
- Profiler activation
- Welcome screen
- Start profiling
- Profiling overhead
- Snapshots
- Solving performance problems
- Performance bottlenecks
- Optimizing memory usage
- Memory leaks
- Excessive garbage allocation
- Out of memory error (OutOfMemoryError and -XX:+HeapDumpOnOutOfMemoryError)
- Solving 'java.lang.OutOfMemoryError: PermGen space' error
- CPU profiling
- Thread profiling
- Virtual threads support
- Object allocation profiling
- Memory profiling
- Monitor profiling
- Exception profiling
- Telemetry
- Probes: monitor events of various kinds
- Inspections: automatic recognition of typical problems
- Automatically trigger actions on event
- Automatic deobfuscation
- Summary
- Filters
- Profiler command line
- Export of profiling results to external formats
- Profiler Java API
- Profiler HTTP API
- Settings
- Troubleshooting and FAQ
Solving 'java.lang.OutOfMemoryError: PermGen space' error
The following article is dedicated to the solution of a "java.lang.OutOfMemoryError: PermGen space" error. This problem is both common and widespread, and in the same time doesn't have a simple solution due to its specific character. For sure, finding PermGen leaks is well-known for many specialists who write Java web-applications and have to redeploy them many times.
Of course, there are some tools, such as standard JDK jmap (Memory Map) and jhat (Heap Analysis Tool), used to somehow deal with finding PermGen leaks, though none of them could be referred to as easy and effective.
Here we will take YourKit Java Profiler and its Class loader view in order to confirm that the aforementioned problem may be now easily solved.
Consider a simple example of a web application on Tomcat server. We will demonstrate several steps which should be done to hunt down the "java.lang.OutOfMemoryError: PermGen space" error with the help of YourKit Java Profiler.
Step 1. Start profiling
Step 2. Load up, use and undeploy your application in the way you usually do it.
Step 3. Use
 toolbar button to capture a memory snapshot.
Then open the obtained snapshot to start analysis.
toolbar button to capture a memory snapshot.
Then open the obtained snapshot to start analysis.
Step 4. Now it is the right time to examine Class loader view. As far as finding PermGen memory leaks is the case, we should first of all focus on classes without instances. And that is exactly what Class loader view shows us in Classes w/o instances column. We can now easily identify classes which belong to our profiled application and may cause the leak. This may be known by large or increasing number of the class instances.
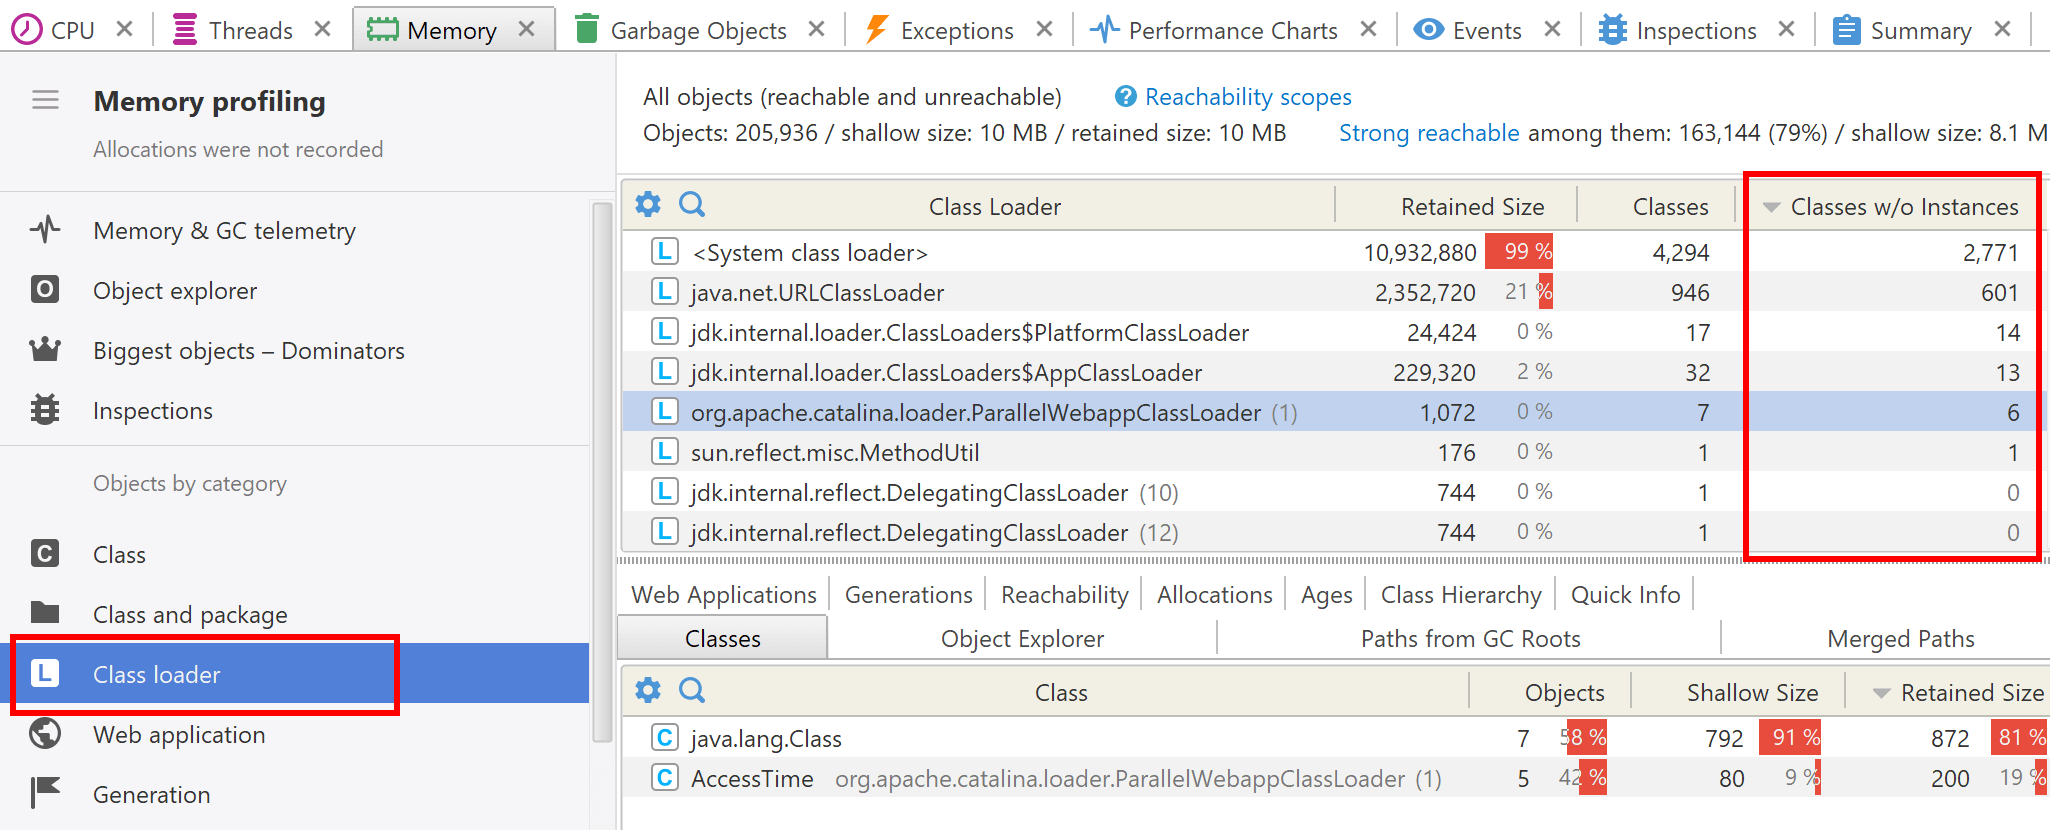
As we see, there is org.apache.catalina.loader.ParallelWebappClassLoader which has 7 classes
and 6 without instances among them. These classes definitely belong to our profiled application,
although the application itself has been already undeployed.
Step 5. After we have identified classes without instances it should be found out why
org.apache.catalina.loader.ParallelWebappClassLoader is still present.
At this point, we will use Paths from GC Roots tab,
which shows the consecutive chain of objects referencing each other
and leading to the loader which we are interested in.
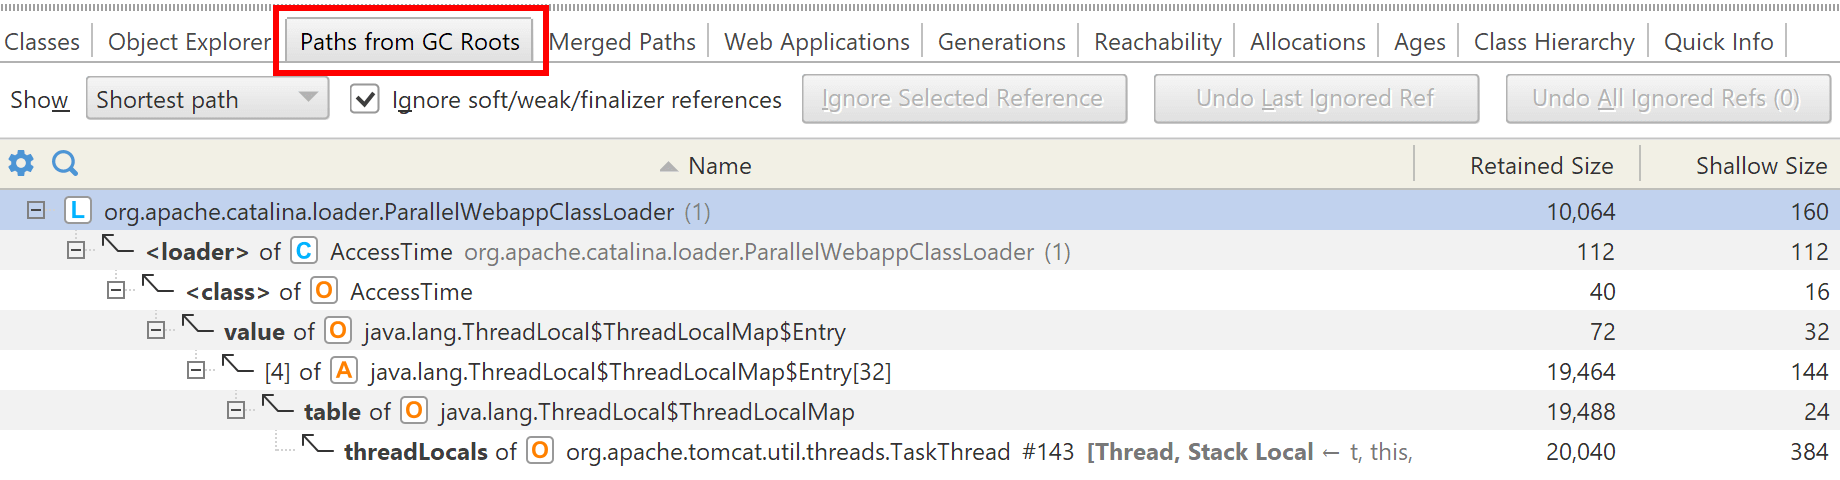
After studying paths, we can say why org.apache.catalina.loader.ParallelWebappClassLoader has not been
collected. It is a loader of AccessTime class with the instance stored in ThreadLocalMap
of a server thread.
And now let's take a look into the corresponding source code fragment of the profiled application:
public class AccessUtil {
  private static ThreadLocal<AccessTime> threadLocal = new ThreadLocal<>();

  public static Date getLastAccessTime() {
    final AccessTime accessTime = threadLocal.get();

    threadLocal.set(new AccessTime());

    return accessTime != null ? accessTime.value : new Date();
  }
}

final class AccessTime {
  public Date value = new Date();

  public AccessTime() {
    new Class1();
  }
}

final class Class1 {
  public Class1() {
    new Class2();
  }
}

final class Class2 {
  public Class2() {
    new Class3();
  }
}

final class Class3 {
}