- System requirements
- Profiler architecture
- Profiler installation
- Uninstall profiler
- Running the profiler
- Profiler activation
- Welcome screen
- Start profiling
- Profiling overhead
- Snapshots
- Solving performance problems
- CPU profiling
- Thread profiling
- Virtual threads support
- Object allocation profiling
- Memory profiling
- Monitor profiling
- Exception profiling
- Telemetry
- Probes: monitor events of various kinds
- Inspections: automatic recognition of typical problems
- Automatically trigger actions on event
- Automatic deobfuscation
- Summary
- Filters
- Profiler command line
- Export of profiling results to external formats
- Profiler Java API
- Profiler HTTP API
- Settings
- Troubleshooting and FAQ
MyEclipse
YourKit Java Profiler has integration with MyEclipse 2020.9 - 2025.1.
- Plugin installation
- Completing Eclipse plugin installation
- Profiling from Eclipse
- Navigation action
- Troubleshooting
Plugin installation
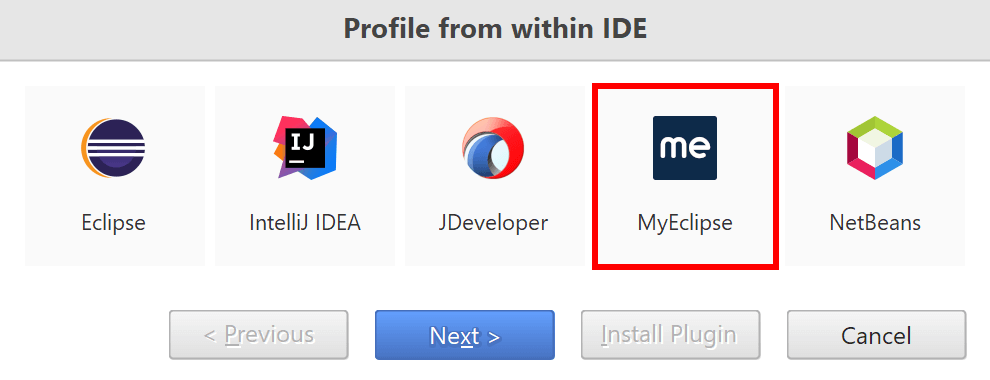
To enable integration, you should install the profiler plugin. Use Profile from within the IDE... action on Welcome screen or in Tools menu.
Choose MyEclipse and follow the instructions.
Completing MyEclipse plugin installation
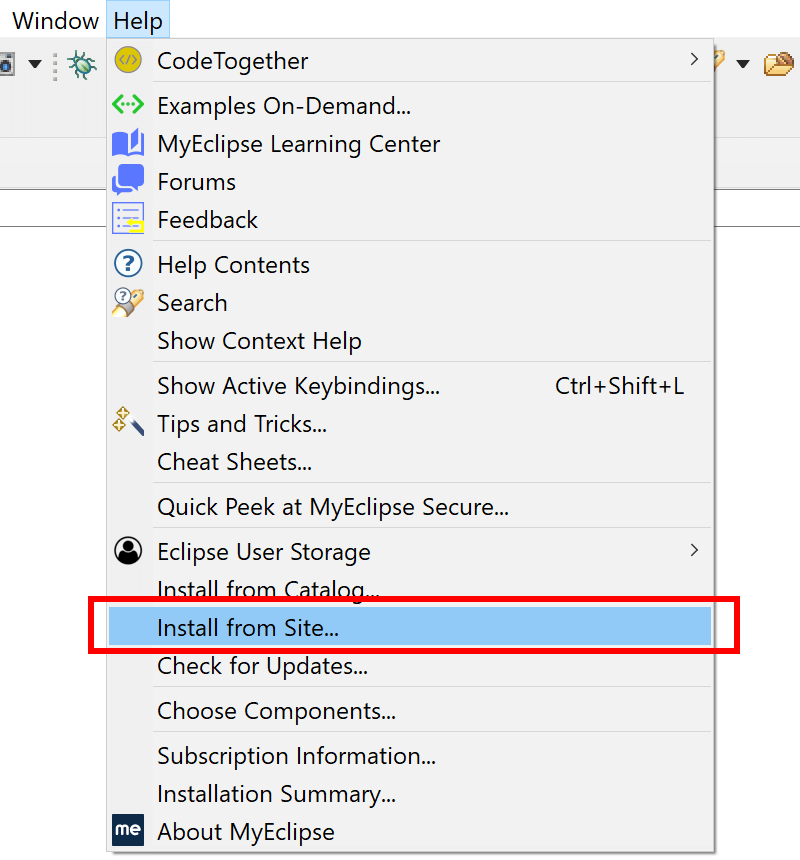
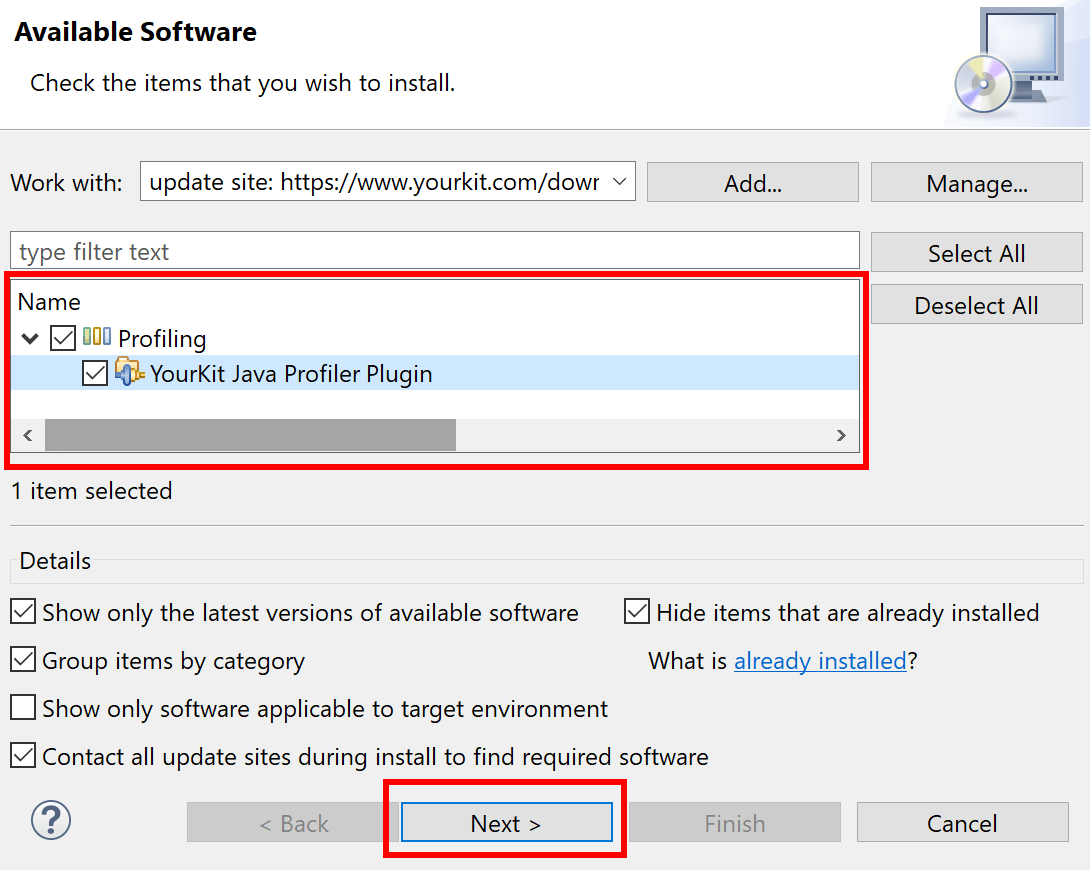
1. Use Help | Install from Site... in MyEclipse's main menu:
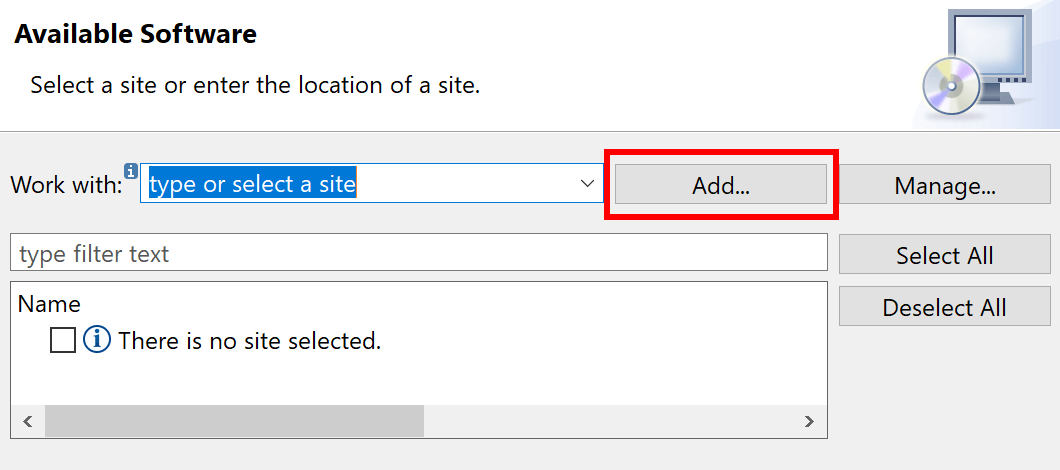
2. Press Add... button:
3. Copy the following URL to the Location field and press Add.
https://www.yourkit.com/download/yjp2025_3_for_eclipse/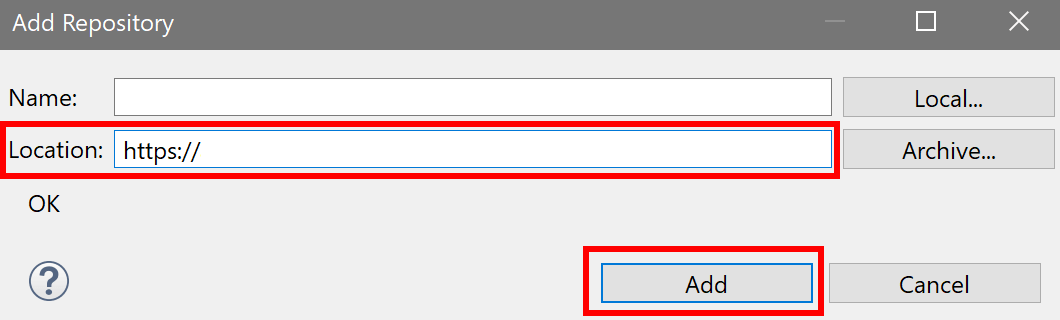
For an offline installation use bundled update site archive at
<Profiler Installation Directory>/lib/eclipse-plugin/yjp2025_3_for_eclipse.zip
4. Select YourKit Java Profiler plugin and press Next:
5. Follow further instructions to complete the plugin installation, restarting MyEclipse if necessary.
Profiling from MyEclipse
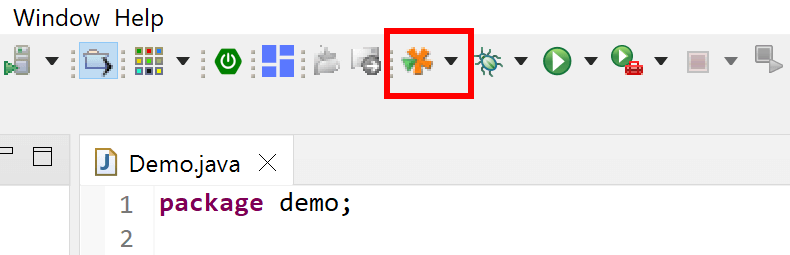
After the plugin is installed, Profile actions appear in the toolbar, in the main menu, and in context menus.
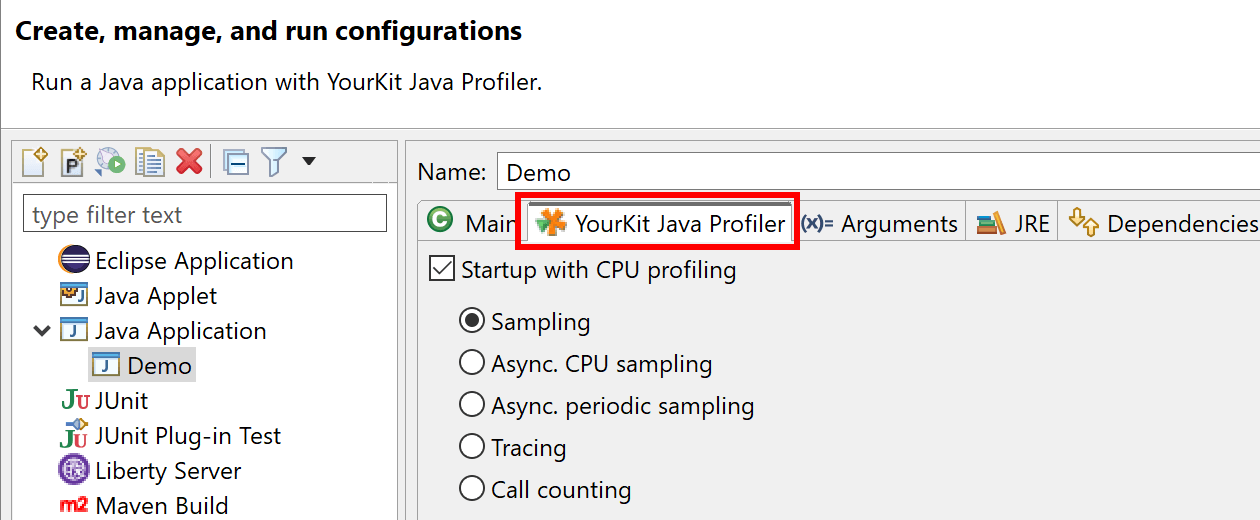
Launch configurations can be managed using Run | Profile... menu, where profiler options are set on YourKit Java Profiler tab.
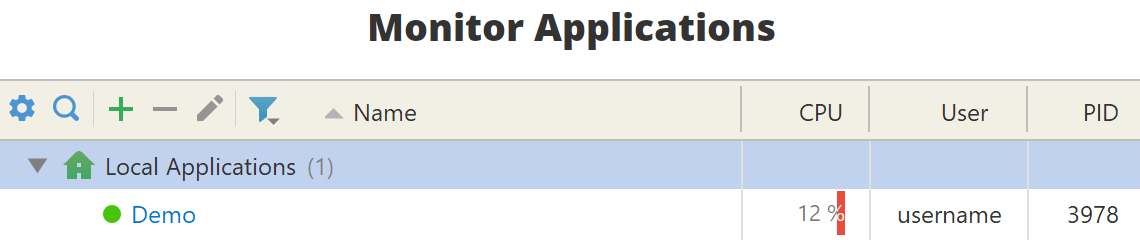
The Profile action starts the profiled application, and connects to it from the profiler UI, unless the opposite is configured. Furthermore, the application will appear in Monitor Applications list on Welcome screen.
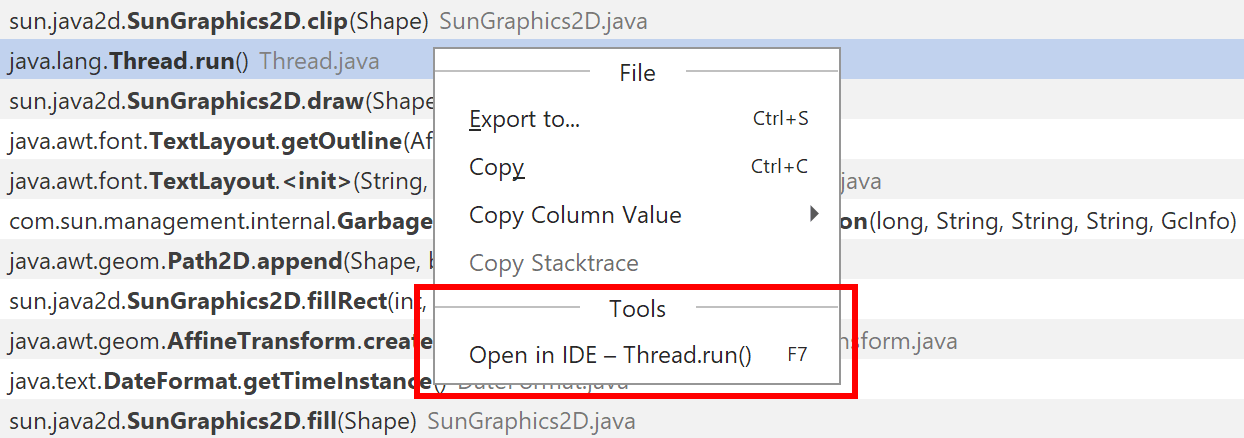
Navigation action
While profiling, you usually need to browse the related source code to understand the performance problems at hands. After the problem is located, you edit the source code to fix it.
Use Tools | Open in IDE (F7) to open the underlying source code in the editor of your IDE - the best place to browse and edit code.
The navigation action works on the current selection and is available in both CPU and memory views. Additionally, it offers the extremely useful ability to locate the code of anonymous classes and their methods, a task that is typically very challenging to accomplish manually.
Troubleshooting
If plugin is installed, but Profile
menu items are still disabled, then this can be plugin caching issue.
To clean up the plugin cache, please restart MyEclipse with -clean
option in the command line.