- System requirements
- Profiler architecture
- Profiler installation
- Uninstall profiler
- Running the profiler
- Profiler activation
- Welcome screen
- Start profiling
- Profiling overhead
- Snapshots
- Solving performance problems
- CPU profiling
- Thread profiling
- Virtual threads support
- Object allocation profiling
- Memory profiling
- Monitor profiling
- Exception profiling
- Telemetry
- Probes: monitor events of various kinds
- Inspections: automatic recognition of typical problems
- Automatically trigger actions on event
- Automatic deobfuscation
- Summary
- Filters
- Profiler command line
- Export of profiling results to external formats
- Profiler Java API
- Profiler HTTP API
- Settings
- Troubleshooting and FAQ
Attach profiler to a running application
Attach technique allows loading the profiler agent into running JVM. Attaching the profiler agent simplifies profiling, as it avoids a special step to enable profiling: any running Java application can be profiled on demand. Unfortunately, the attach mode is not an ultimate solution, because attaching to a running JVM is not always possible, and some profiling features are not available.
Attaching from profiler UI
All detected running Java processes are shown in the Monitor Applications list on Welcome screen. The colored circle indicates the profiler agent status. When the agent is already loaded, the circle is green. Orange circle shows that agent is not yet loaded but can be attached.
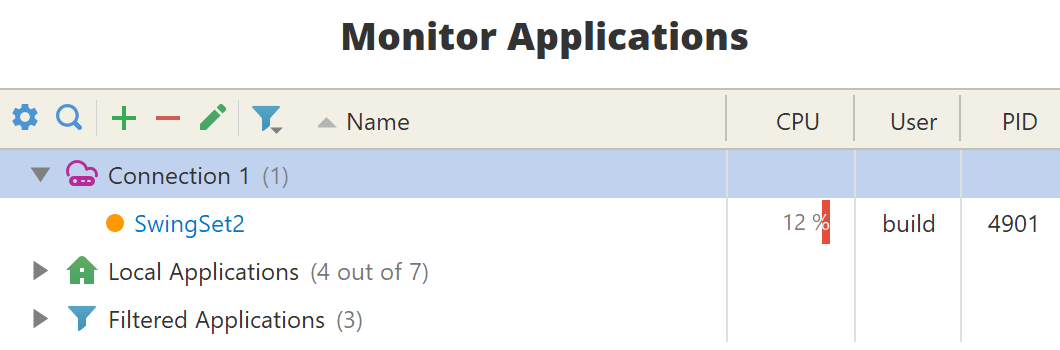
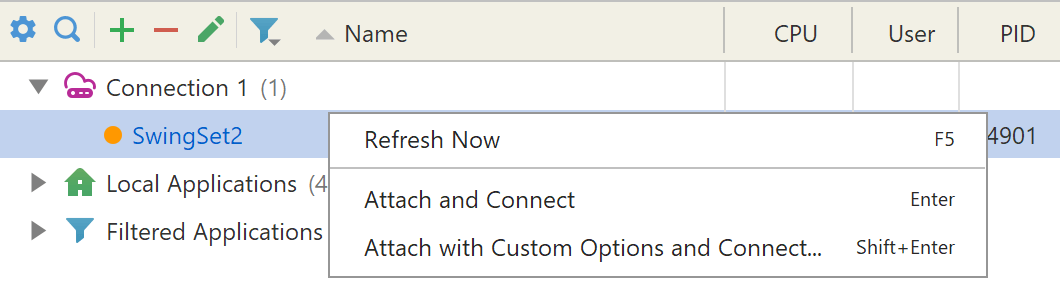
Attach to the application you want to profile by clicking on its name. Attach from context menu to provide custom agent options.
Attaching is possible to both local and remote applications.
Local applications are shown under the node with  icon.
Applications running on the remote machines are shown under their own nodes with
icon.
Applications running on the remote machines are shown under their own nodes with  icon.
To add a new remote machine click
icon.
To add a new remote machine click  .
See remote profiling from user interface
to learn more.
.
See remote profiling from user interface
to learn more.
If you do not see your application it the list, please check troubleshooting and FAQ.
Console attach wizard
Console wizard might be useful if you want to profile remote Java server or the machine has no graphics environment.
Running the wizard
Install profiler on the machine where your Java application is running. License key is not required to use the wizard.
Run the command below:
Linux
<profiler directory>/bin/profiler.sh -attach <PID> <startup_options>macOS
<profiler directory>/Contents/Resources/bin/profiler.sh -attach <PID> <startup_options>Windows
<profiler directory>\bin\profiler.bat -attach <PID> <startup_options>
<PID>is an optional parameter.
Specify it to immediately attach the agent to a particular application.
If <PID> is not specified,
the wizard will show the list of running JVMs
and offer to choose to which JVM to connect.
<startup_options>
is an optional parameter to specify additional
agent startup options.
If <PID> parameter is not specified,
the wizard will also offer to specify startup options.
Executing the command without any parameters will display running Java processes and start an interactive wizard:
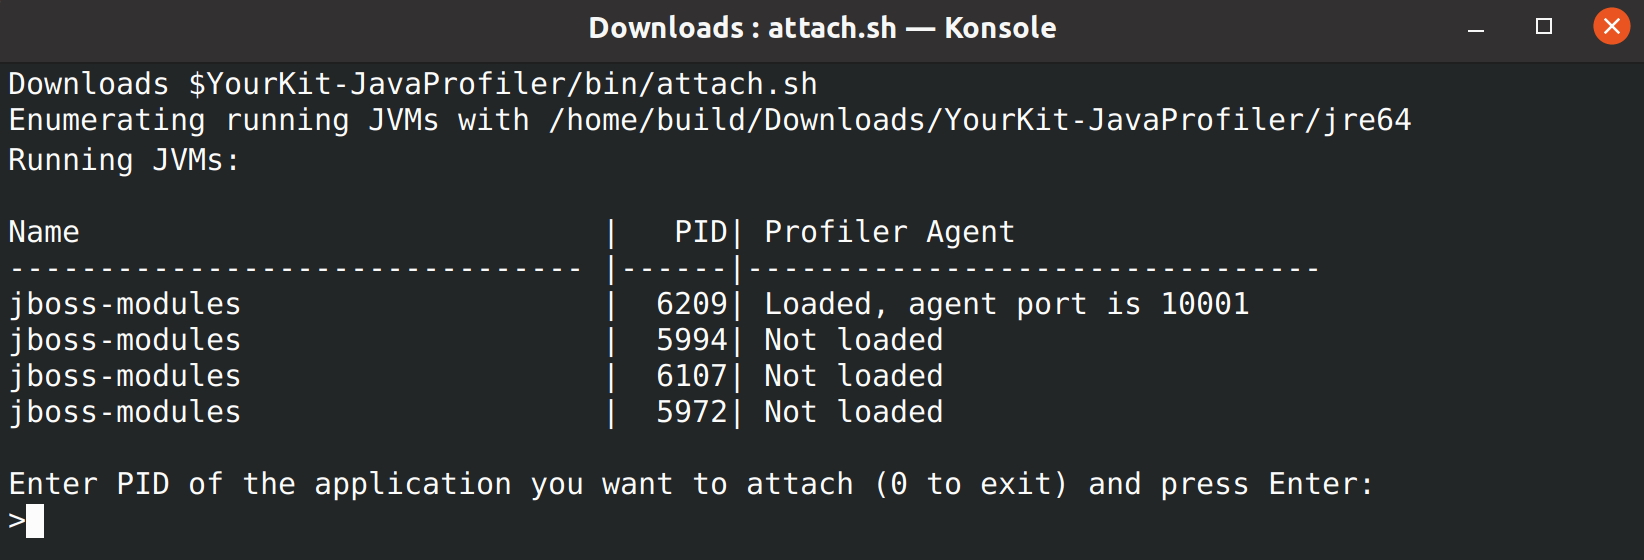
After the profiler agent is attached, its port will be printed out. Use this port number to connect to the application and start profiling.
Attach mode limitations
Existing JVMs provide only limited set of profiling capabilities for the attached agents. To get all profiling capabilities, you still have to start the profiled application with the profiler agent instead.
-
Exception profiling is not available.
-
Attach may fail due to insufficient access rights. For example, it may not be possible to attach to a Java server running as a Windows service. If attempt to attach fails, start the application with the profiler agent instead.
-
A long pause is possible on first attempt to start CPU tracing or object allocation profiling, because classes loaded before the profiler agent has attached need to be instrumented. Depending on application, it can take from several seconds to several tens of seconds, or even a few minutes in worst cases. The good news is that there will be no pause on subsequent starts of CPU tracing or object allocation profiling for the same running JVM instance.
-
No profiling results for some methods:
- JVM may not be able to apply bytecode instrumentation to methods of the objects that have been created before the agent attached. Instead, the old, non-instrumented version of the bytecode will keep running for them. This is a limitation of the JVM.
- Another JVM limitation is that native methods of classes that have loaded before the profiler agent attached cannot be instrumented at all. (There is no problem with classes loaded after the profiler has attached.)
This means that their calls will be missing in: