- System requirements
- Profiler architecture
- Profiler installation
- Uninstall profiler
- Running the profiler
- Profiler activation
- Welcome screen
- Start profiling
- IDE integration
- Java server integration wizard
- Attach profiler to a running application
- Remote profiling
- AWS SSM
- Direct connect
- SSH access
- Connection broker
- Profiling in Docker container
- Profiling in Amazon EC2 instance
- Enabling profiling manually
- Agent startup options
- Connect to profiled application
- Profiling overhead
- Snapshots
- Solving performance problems
- CPU profiling
- Thread profiling
- Virtual threads support
- Object allocation profiling
- Memory profiling
- Monitor profiling
- Exception profiling
- Telemetry
- Probes: monitor events of various kinds
- Inspections: automatic recognition of typical problems
- Automatically trigger actions on event
- Automatic deobfuscation
- Summary
- Filters
- Profiler command line
- Export of profiling results to external formats
- Profiler Java API
- Profiler HTTP API
- Settings
- Troubleshooting and FAQ
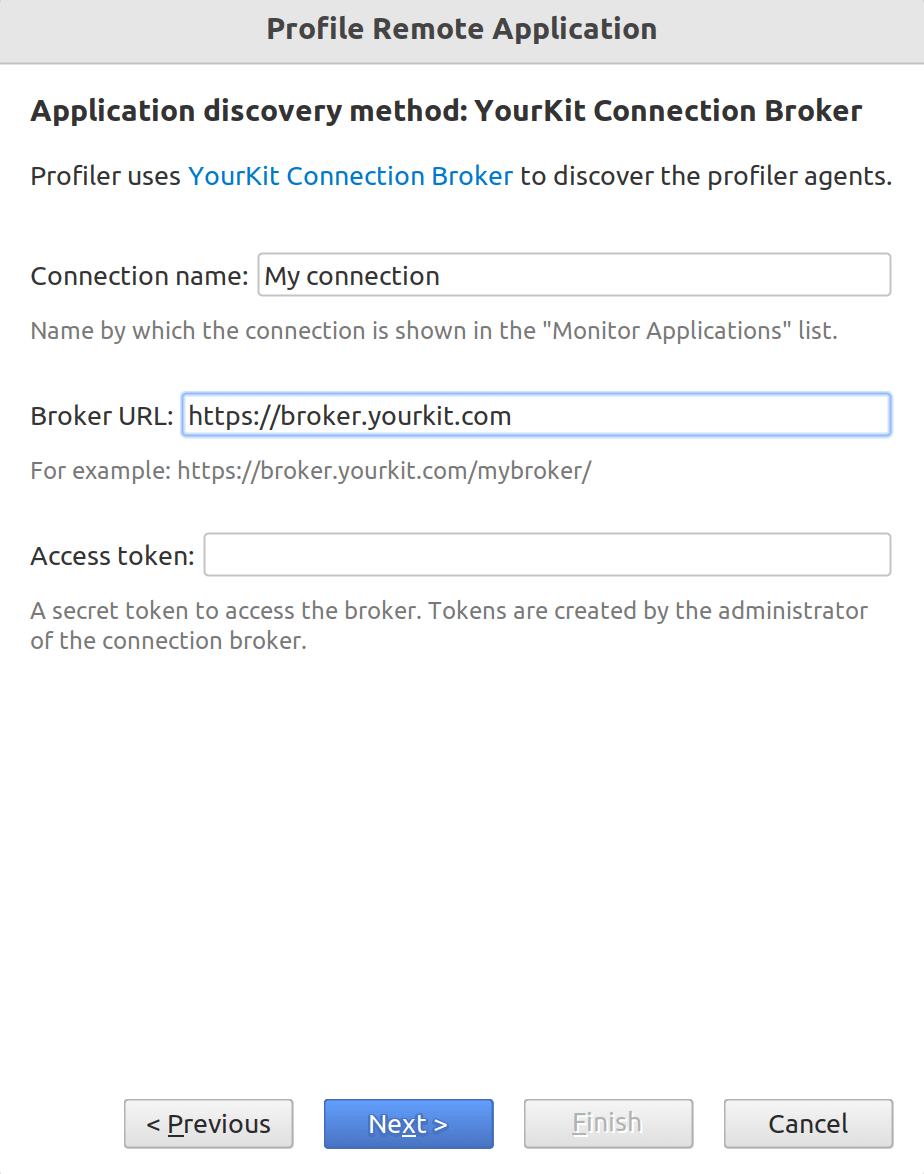
Connection broker
YourKit Connection Broker makes profiling in clouds, containers and clustered environments super easy and convenient. The broker greatly simplifies connectivity between profiler UI and profiler agent, and brings extra layer of security and fine-grained control for accessing the profiled applications.
If you do not have YourKit Connection Broker account, please read this short article, which describe how to get started with the connection broker.
Advantages
- Ideal for clouds, containers and clustered environments.
- No need to configure firewalls and expose ports.
- No need to have SSH access to the remote host.
- No need to know the IP address and port of the profiler agent to connect to it.
- Profiler agents do not open TCP sockets to listen the incoming connections.
- Extra layer of security and fine-grained control for accessing the profiled applications.