- System requirements
- Profiler architecture
- Profiler installation
- Uninstall profiler
- Running the profiler
- Profiler activation
- Welcome screen
- Start profiling
- Profiling overhead
- Snapshots
- Solving performance problems
- CPU profiling
- Thread profiling
- Virtual threads support
- Object allocation profiling
- Memory profiling
- Monitor profiling
- Exception profiling
- Telemetry
- Probes: monitor events of various kinds
- Inspections: automatic recognition of typical problems
- Automatically trigger actions on event
- Automatic deobfuscation
- Summary
- Filters
- Profiler command line
- Export of profiling results to external formats
- Profiler Java API
- Profiler HTTP API
- Settings
- Troubleshooting and FAQ
CPU telemetry
CPU telemetry is a subset of the wide range of telemetries collected by YourKit Java Profiler. It specifically involves gathering data about the CPU time consumed by the application in both user mode and kernel mode, as well as an overall view of system CPU usage. By monitoring CPU usage, you can identify and analyze CPU spikes or periods of high CPU usage. Once these areas are identified, you can delve into the code to optimize inefficient operations.
CPU telemetry charts
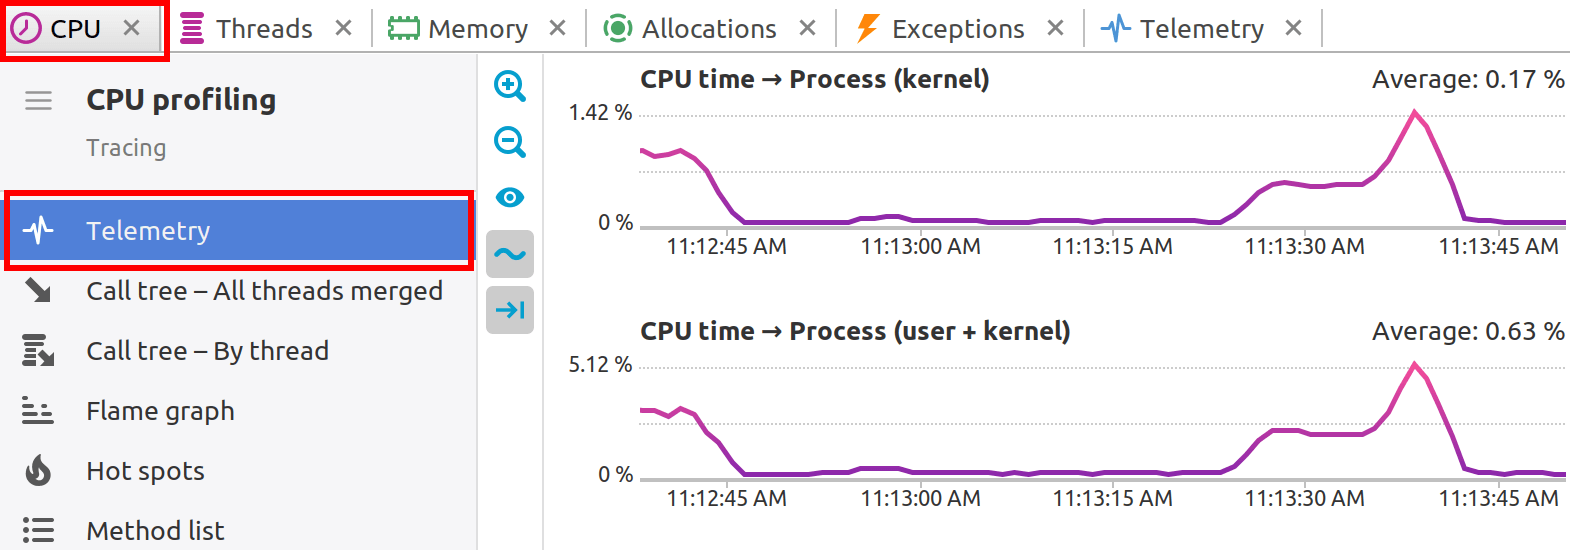
CPU time > Process (kernel)
This chart tracks the CPU time spent by a specific process in kernel mode. Profiling time spent in kernel mode is crucial when diagnosing issues related to system calls, interrupt handling, or other low-level operations that require the kernel's intervention.
CPU time > Process (user + kernel)
This chart displays the total CPU time consumed by a process, combining both user mode and kernel mode. This metric is important for understanding the overall CPU demand that a process is placing on the system.
CPU time > System
While this chart displays the overall system CPU time usage, comparing this with process-specific CPU time can reveal correlations between an application's performance and the activity of other processes running on the system.
Toolbar
-

 :
Zoom in and out to quickly change the range of visible data.
:
Zoom in and out to quickly change the range of visible data.
-
 :
Show "empty" charts, i.e. the charts that have only zero values.
:
Show "empty" charts, i.e. the charts that have only zero values.
-
 :
Smooth out short-term fluctuations on graphs.
This is useful for visualizing of fast-changing data.
:
Smooth out short-term fluctuations on graphs.
This is useful for visualizing of fast-changing data.
-
 :
Control auto-scrolling behavior of telemetry charts.
When toggled, the graphs will be automatically scrolled to the right
when new data arrives.
:
Control auto-scrolling behavior of telemetry charts.
When toggled, the graphs will be automatically scrolled to the right
when new data arrives.
Working with telemetry charts
Clicking on chart: Clicking on a chart reveals the call stacks of the Java threads running at that specific moment, providing a snapshot of the application's state.
Selecting the time interval: Analyzing performance over a time span is equally straightforward. By selecting a range within the telemetry data, profiler builds an estimated call tree and computes the CPU usage for that interval. This can be invaluable for pinpointing performance bottlenecks or understanding the behavior of the application during periods of high load.