- System requirements
- Profiler architecture
- Profiler installation
- Uninstall profiler
- Running the profiler
- Profiler activation
- Welcome screen
- Start profiling
- Profiling overhead
- Snapshots
- Solving performance problems
- CPU profiling
- Thread profiling
- Virtual threads support
- Object allocation profiling
- Memory profiling
- Monitor profiling
- Exception profiling
- Telemetry
- Probes: monitor events of various kinds
- Inspections: automatic recognition of typical problems
- Automatically trigger actions on event
- Automatic deobfuscation
- Summary
- Filters
- Profiler command line
- Export of profiling results to external formats
- Profiler Java API
- Profiler HTTP API
- Settings
- Troubleshooting and FAQ
CPU sampling settings
CPU sampling settings allow to customize some aspects of CPU sampling.
CPU tracing settings are specified separately, as described here.
When the settings are applied
The settings are applied each time you start CPU sampling. This means you can change the settings without restarting the profiled application.
Configuring the settings
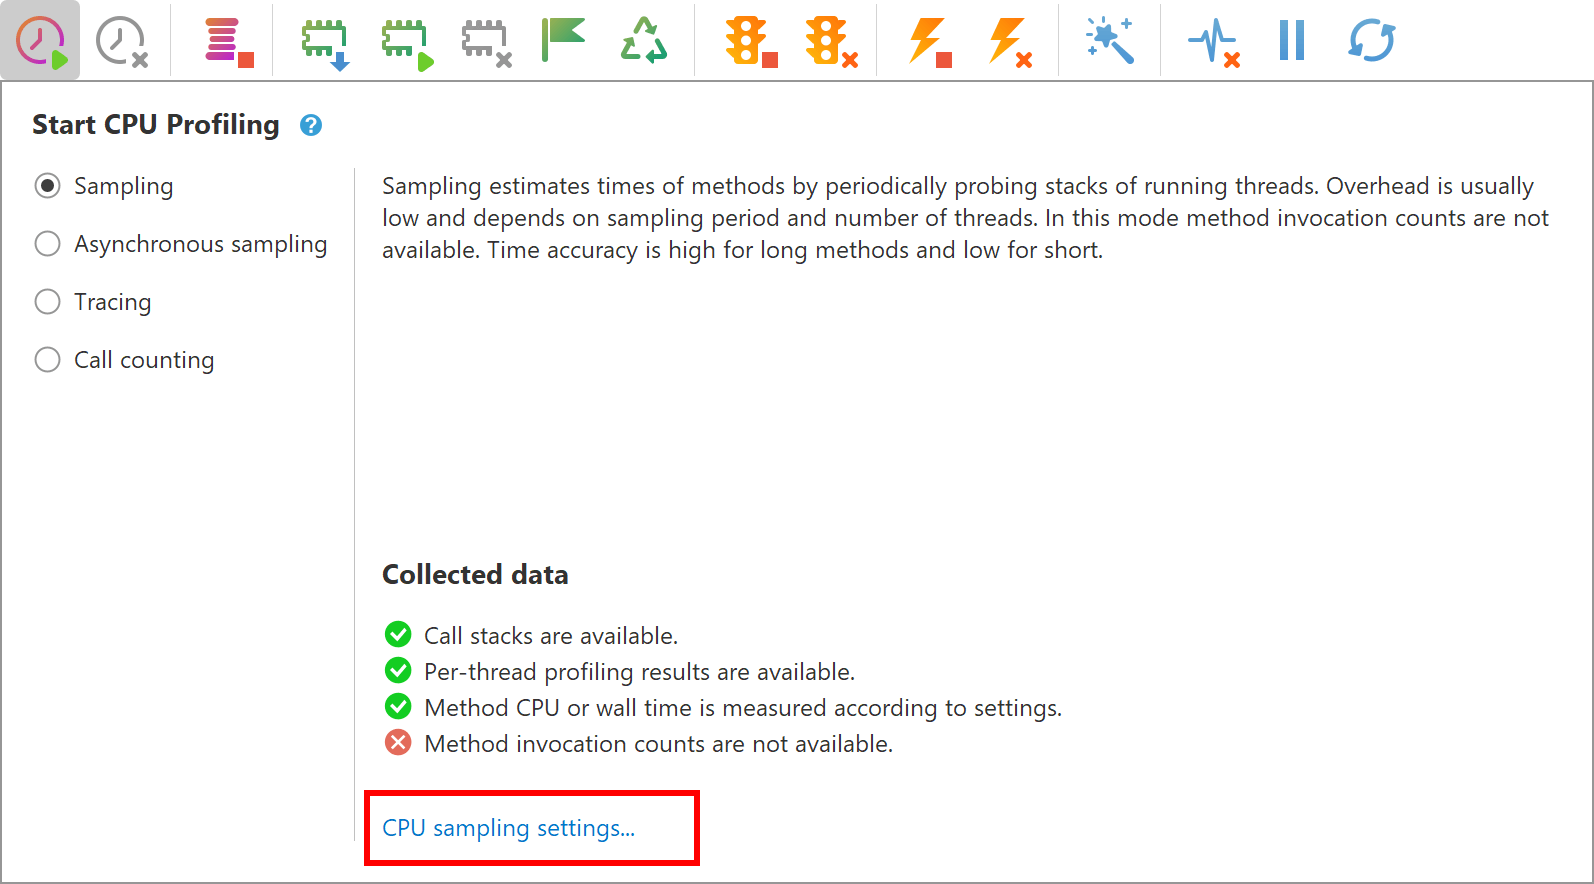
To configure CPU sampling settings use Settings | CPU Sampling... in the main menu.
The settings are also accessible via a link in the CPU profiling toolbar popup:
The following dialog appears:
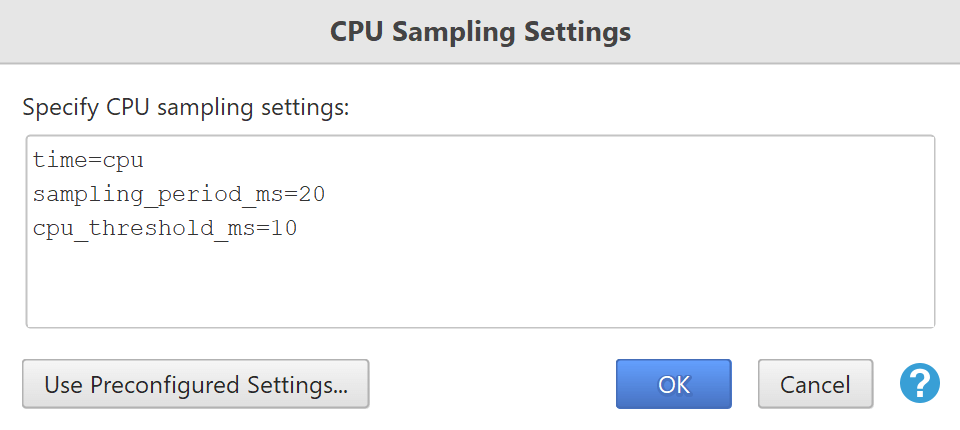
Configurable properties:
-
Time measurement
Specify whether CPU or wall time will be measured for profiled methods by using the
timeproperty.By default, CPU time is measured which corresponds to the option
time=cpu.With synchronous and asynchronous periodic sampling, it's possible to measure wall time instead by using
time=wall.Asynchronous CPU sampling always measures CPU time, the
timeproperty value is ignored.When starting sampling from the profiler UI, choose the option via Use Preconfigured Settings... or manually edit the property value.
-
Sampling period (synchronous and asynchronous periodic sampling)
Specify how often samples are taken with
sampling_period_ms=<time in milliseconds>. By default, samples are taken each 20 milliseconds (sampling_period_ms=20). -
CPU threshold (asynchronous CPU sampling)
Specify CPU time threshold for asynchronous CPU sampling with
cpu_threshold_ms=<time in milliseconds>. By default, CPU time threshold is 10 milliseconds.
Configuration file
The settings are stored in the file
<user home>/.yjp/sampling_2022.txt
where user home corresponds to the account under which a profiled application is launched.
This file is automatically updated in your user home directory when you apply changes in the UI (see above).
You can edit this file manually, but note that it may be fully overwritten with Use Preconfigured Settings... in UI.
The settings file is read and applied when CPU sampling is started with:
-
API methods
Controller.startSampling*(null) - HTTP API with absent settings
-
trigger actions
StartSampling,StartAsyncSamplingCpu,StartAsyncSamplingPeriodic
You can specify a custom settings file for a particular application
by using the startup option
sampling_settings_path