- System requirements
- Profiler architecture
- Profiler installation
- Uninstall profiler
- Running the profiler
- Profiler activation
- Welcome screen
- Start profiling
- Profiling overhead
- Snapshots
- Solving performance problems
- CPU profiling
- Thread profiling
- Virtual threads support
- Object allocation profiling
- Memory profiling
- Monitor profiling
- Exception profiling
- Telemetry
- Probes: monitor events of various kinds
- Inspections: automatic recognition of typical problems
- Automatically trigger actions on event
- Automatic deobfuscation
- Summary
- Filters
- Profiler command line
- Export of profiling results to external formats
- Profiler Java API
- Profiler HTTP API
- Settings
- Troubleshooting and FAQ
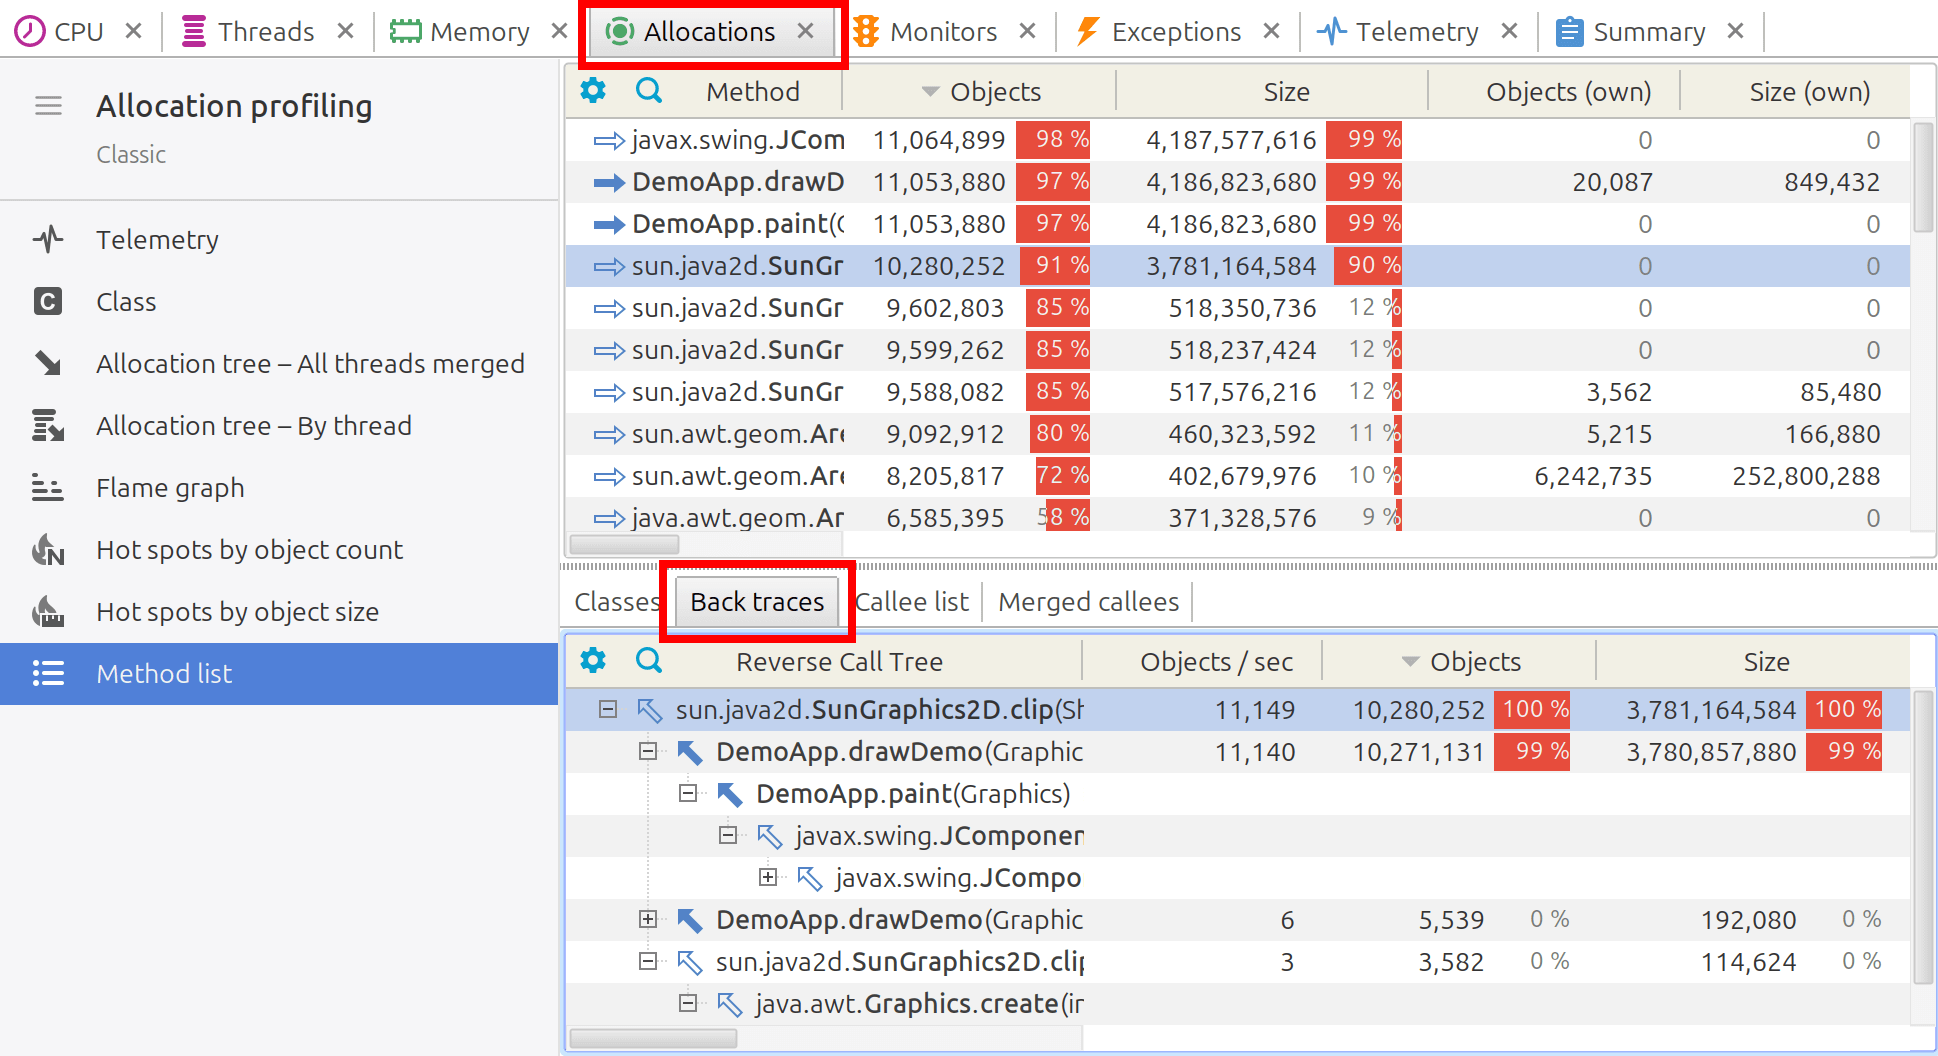
Back traces for allocating method
The method Back traces view displays all stacks in which a given method was called, presented as a reverse call tree of all stacks. A reverse call tree is a visualization of method execution that traces calls backward from a specific method to all possible callers in the program. Unlike a standard call tree, which shows how a method invokes other methods, a reverse call tree helps understand where and how often a method is being called.