- System requirements
- Profiler architecture
- Profiler installation
- Uninstall profiler
- Running the profiler
- Profiler activation
- Welcome screen
- Start profiling
- Profiling overhead
- Snapshots
- Solving performance problems
- CPU profiling
- Thread profiling
- Virtual threads support
- Object allocation profiling
- Memory profiling
- Monitor profiling
- Exception profiling
- Telemetry
- Probes: monitor events of various kinds
- Inspections: automatic recognition of typical problems
- Automatically trigger actions on event
- Automatic deobfuscation
- Summary
- Filters
- Profiler command line
- Export of profiling results to external formats
- Profiler Java API
- Profiler HTTP API
- Settings
- Troubleshooting and FAQ
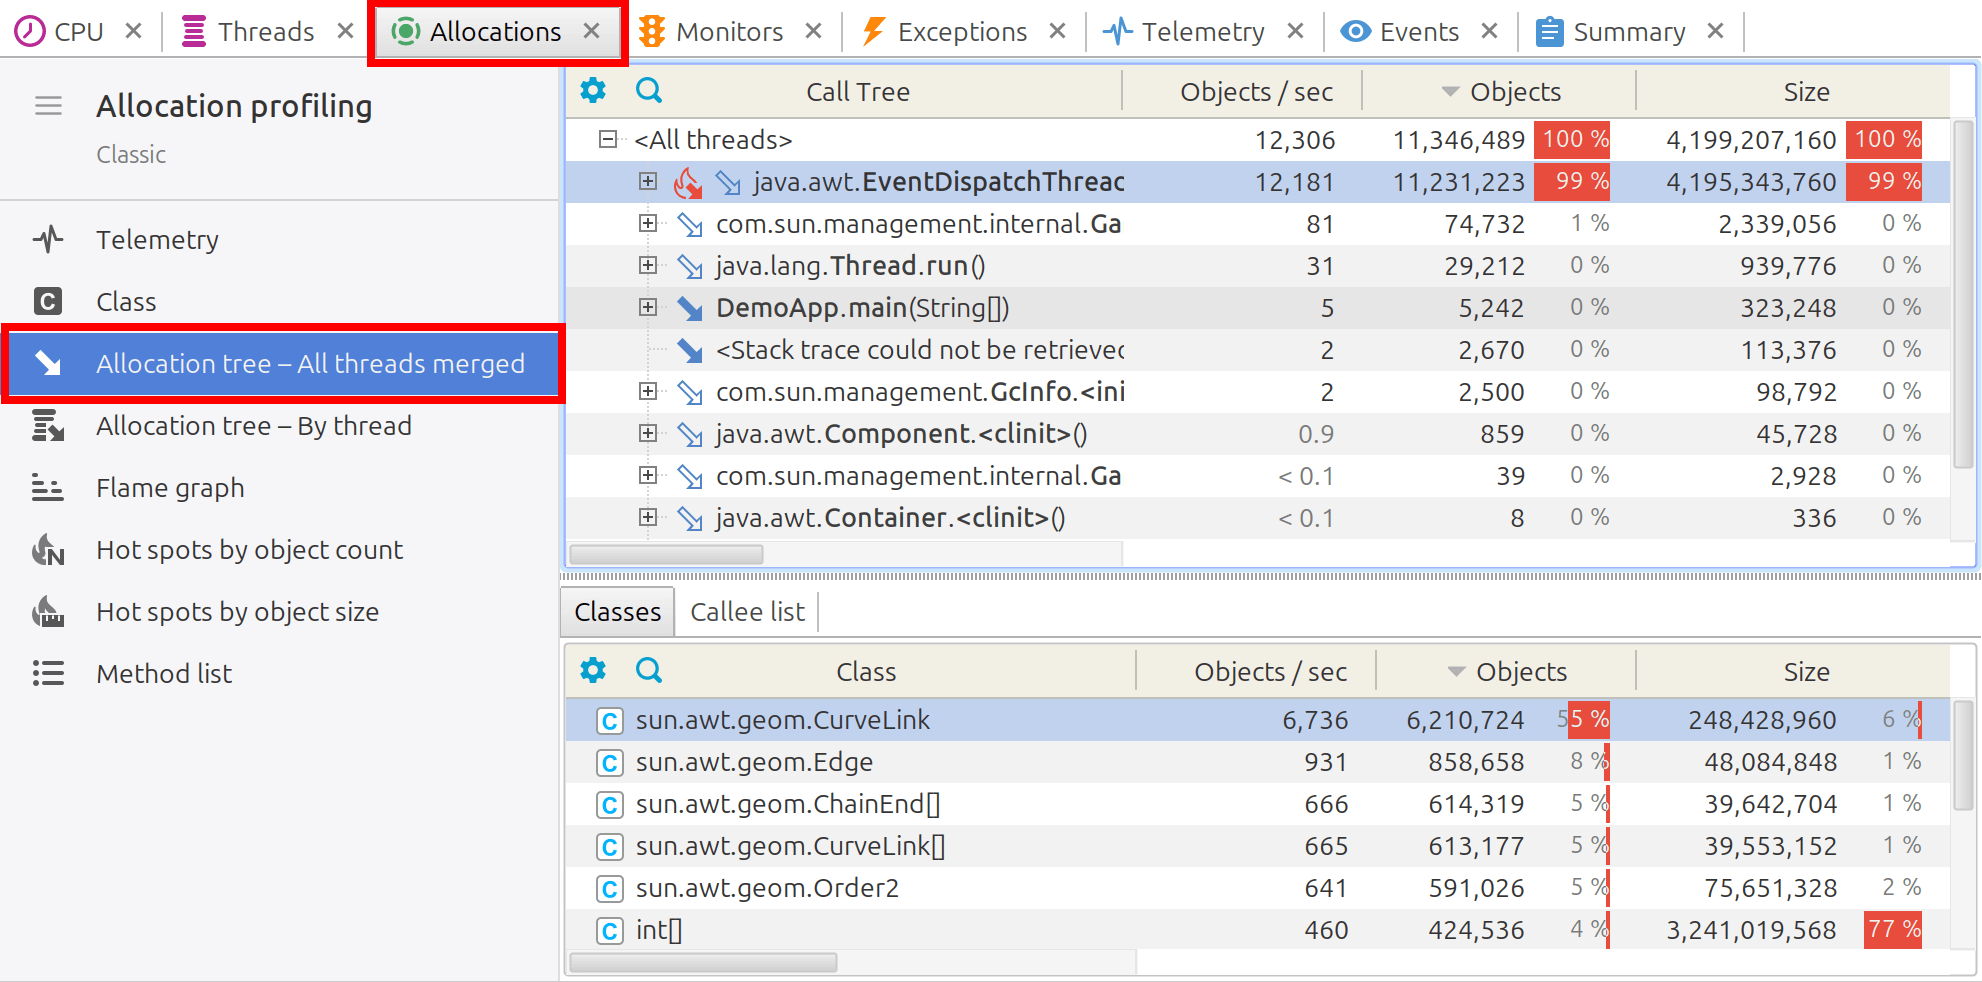
Allocation tree - All threads merged
An allocation tree is a hierarchical representation that illustrates the sequence and relationships of method invocations within a program, where objects have been allocated. It visually captures how different methods are called and nested during the execution of the program.
All threads merged call tree aggregates traces of object allocations from all Java threads into a single tree. For analyzing object allocations within a specific Java thread, please consider using Allocation tree - By thread view.