- System requirements
- Profiler architecture
- Profiler installation
- Uninstall profiler
- Running the profiler
- Profiler activation
- Welcome screen
- Start profiling
- Profiling overhead
- Snapshots
- Solving performance problems
- CPU profiling
- Thread profiling
- Virtual threads support
- Object allocation profiling
- Memory profiling
- Monitor profiling
- Exception profiling
- Telemetry
- Probes: monitor events of various kinds
- Inspections: automatic recognition of typical problems
- Automatically trigger actions on event
- Automatic deobfuscation
- Summary
- Filters
- Profiler command line
- Export of profiling results to external formats
- Profiler Java API
- Profiler HTTP API
- Settings
- Troubleshooting and FAQ
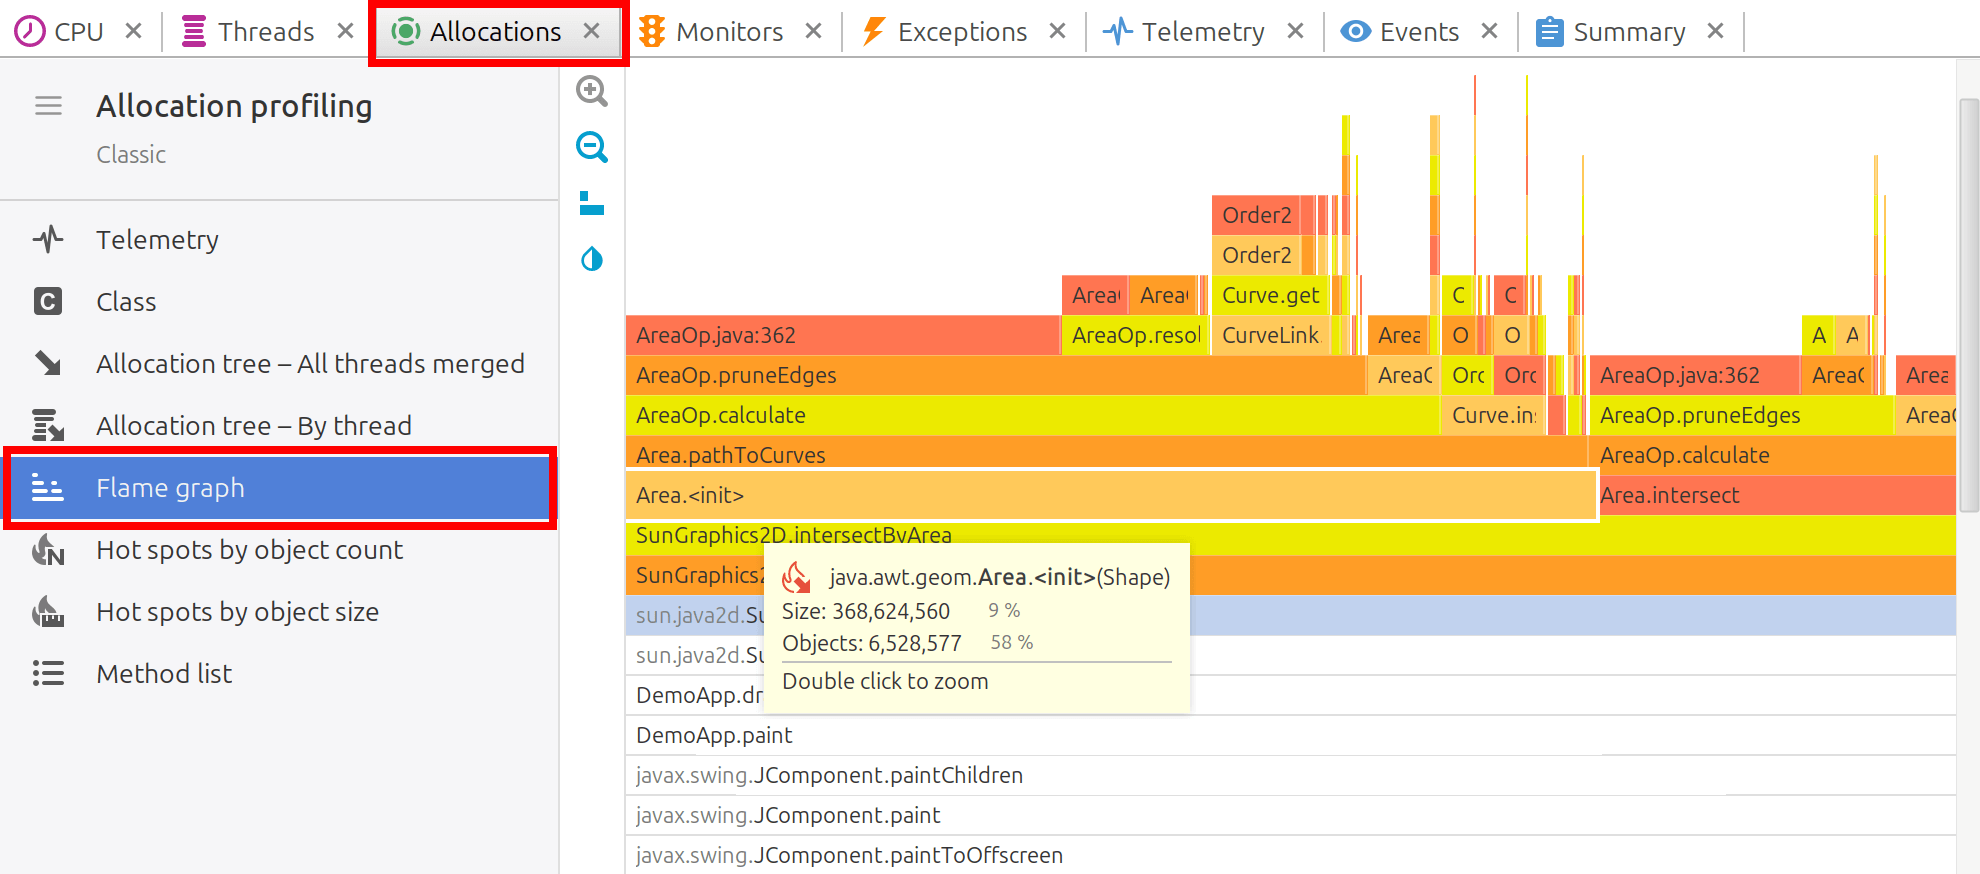
Allocation flame graph
An Allocation flame graph is a way to visualize the entire application call tree, helping to identify performance bottlenecks quickly and easily. Execution paths where more memory is allocated appear wider and more prominent on the graph.
The flame graph is available in both live mode, when profiling a running application, and during the analysis of a captured snapshot. In live mode, the graph updates in real time as the UI synchronizes with the profiler agent.
Layout
Along the horizontal axis, the flame graph arranges stacks based on the amount of allocated memory. The methods that allocate the most memory always appear on the left side of the graph, simplifying analysis.
The width of each graph element is proportional to the number of bytes allocated in the corresponding stack frame. The wider the element, the more bytes have been allocated.
Call stacks are laid out vertically, and grow from bottom to top. That is similar to Java stack trace you can see printed in a console.
Colors
The colors of the graph have no meaning, they just visually separate neighbor elements and are chosen from a flame palette. Red color of an element does not mean that the corresponding method allocates more memory.
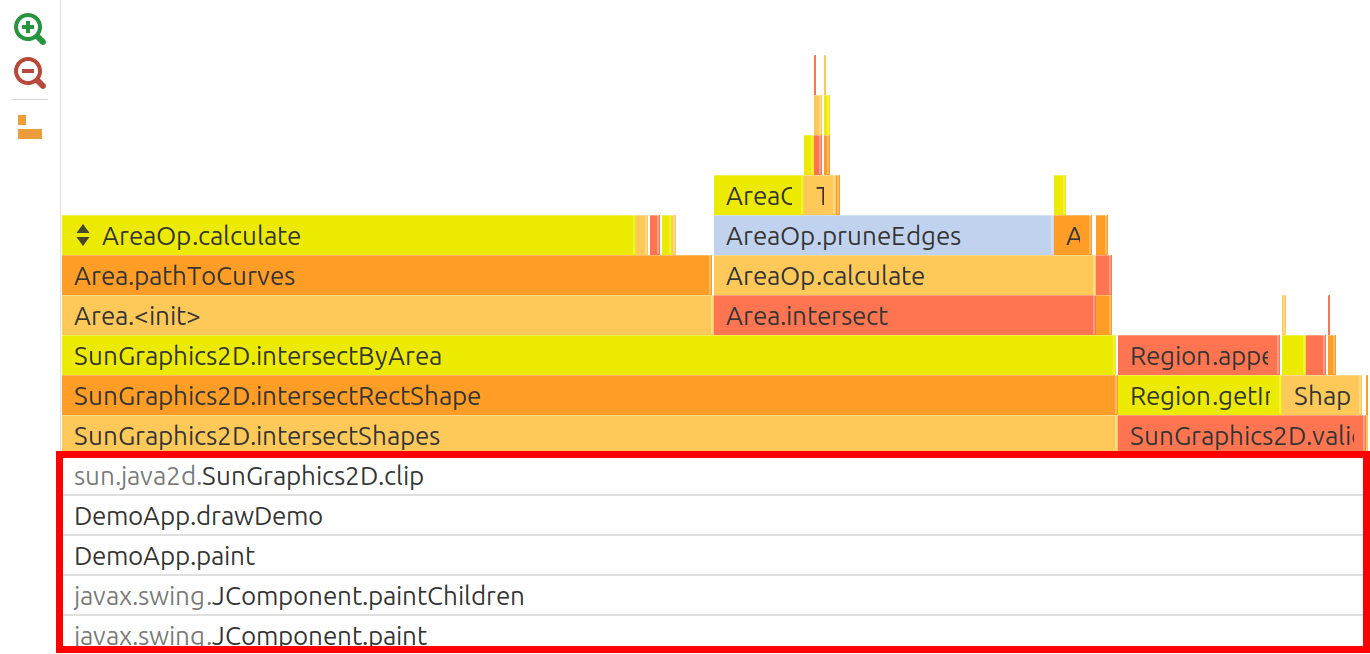
Zoom
Sometimes, you may want to closely inspect a method that didn't allocate much memory. Such methods are usually narrow, making it difficult for the graph to display their called methods. In this case, you can zoom in on the method. The entire graph will be scaled, and the zoomed element will expand to occupy the full screen width, revealing hidden details.
Zooming in can be activated by double-clicking or using the popup menu. Pressing ESC resets the zoom and restores the graph to its original scale.
Filters
Flame graph respects filter settings
and collapse filtered methods the same way as it does
Allocation tree. Inside filtered elements you will see small button
 that allows to unfilter the element.
You can always undo unfiltering by using the Ctrl+Z shortcut or from popup menu.
that allows to unfilter the element.
You can always undo unfiltering by using the Ctrl+Z shortcut or from popup menu.
Actions
The following actions are available in the popup menu:
- File | Export to... (Ctrl+S) - exports flame graph to PNG image.
- Tools | Open in IDE (F8) - opens method declaration in IDE editor. See IDE integration.