- System requirements
- Profiler architecture
- Profiler installation
- Uninstall profiler
- Running the profiler
- Profiler activation
- Welcome screen
- Start profiling
- IDE integration
- Profile .NET executable
- Profile ASP.NET application in IIS
- Profile ASP.NET web app on Azure App Service on Linux
- Profile ASP.NET web app on Azure App Service on Windows
- Profile all .NET processes that will start
- Attach profiler to a running application
- Profile remote applications
- Profiling in Docker container
- Manually enable profiling of local applications
- Agent startup options
- Connect to profiled application
- Profiling overhead
- Snapshots
- Solving performance problems
- CPU profiling
- Thread profiling
- Object allocation profiling
- Memory profiling
- Exception profiling
- Telemetry
- Probes: monitor higher level events
- Inspections: automatic recognition of typical problems
- Automatically trigger actions on event
- Automatic deobfuscation
- Summary, automatic deobfuscation
- Filters
- Profiler command line
- Command line tool to control profiling
- Export of profiling results to external formats
- Profiler .NET API
- Profiler HTTP API
- Settings
- Troubleshooting
Profile remote applications
- 1. Install profiler on the remote machine
- 2. Start profiling the application on the remote machine
- 3. Create new connection to the remote machine
- 4. Connect to the remote application
Remote profiling is the case when the profiled application and the profiler UI run on different machines, usually on a server and your developer machine. To begin remote profiling of your application, you need to perform a few simple steps described below:
1. Install profiler on the remote machine
Download and install profiler to the remote machine. Neither a license key nor profiler activation is required to install the profiler on a remote computer. The installer will automatically extract the profiler agent DLLs and register them with the system. Once the installation is complete, you can utilize the command line tool on the remote machine to execute useful profiling operations. These operations include attaching the profiler agent to a running process and enabling or disabling profiling as needed.
2. Start profiling the application on the remote machine
Start profiling the application.
To ensure it has started with the profiler, check whether the profiler agent log file has been created:
<user home>/.ynp/log/<application name>-<PID>.log
If you want to profile Windows service, then it needs to be restarted. Special notes on profiling a Windows service can be found here.
3. Create new connection to the remote machine
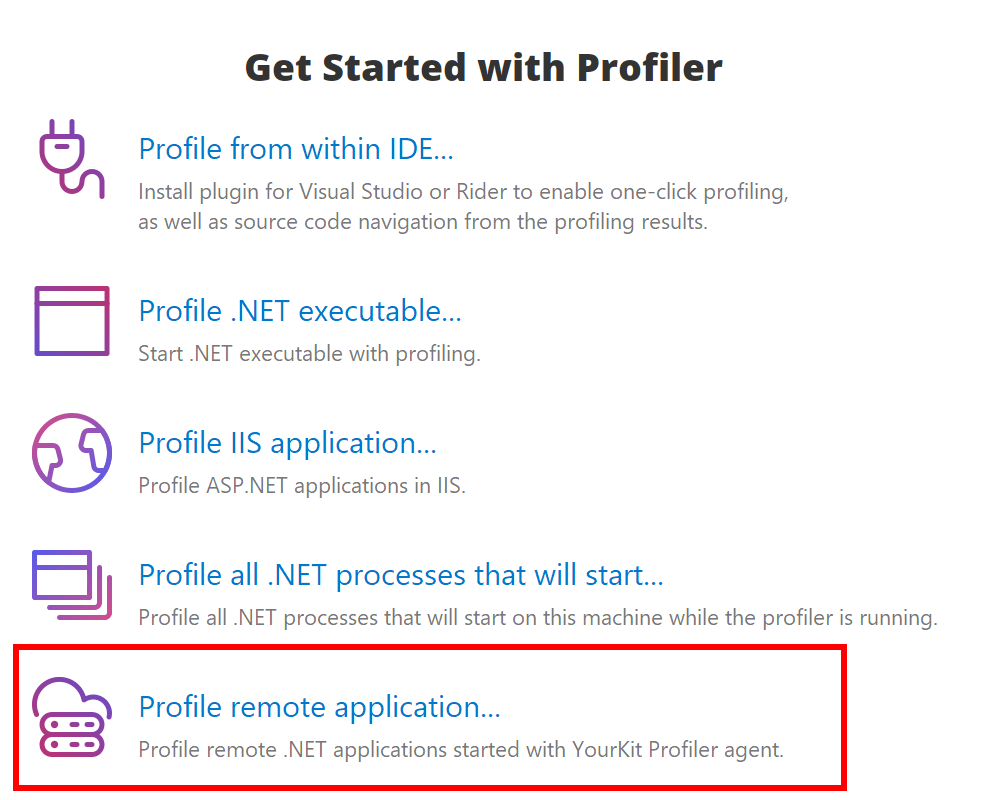
To profile .NET applications running on the remote machine use Profile remote application... action on Welcome screen or in Profile menu.
Choose application discovery method
-
AWS SSM. Connect to an AWS instance using AWS CLI with SSM plugin.
-
Direct connect. Profiler discovers applications running on the remote machine with the profiler agent by scanning open ports.
-
SSH access. Profiler uses SSH to log into the remote machine and find all running .NET applications.
-
YourKit Connection Broker makes profiling in clouds, containers and clustered environments super easy and convenient.
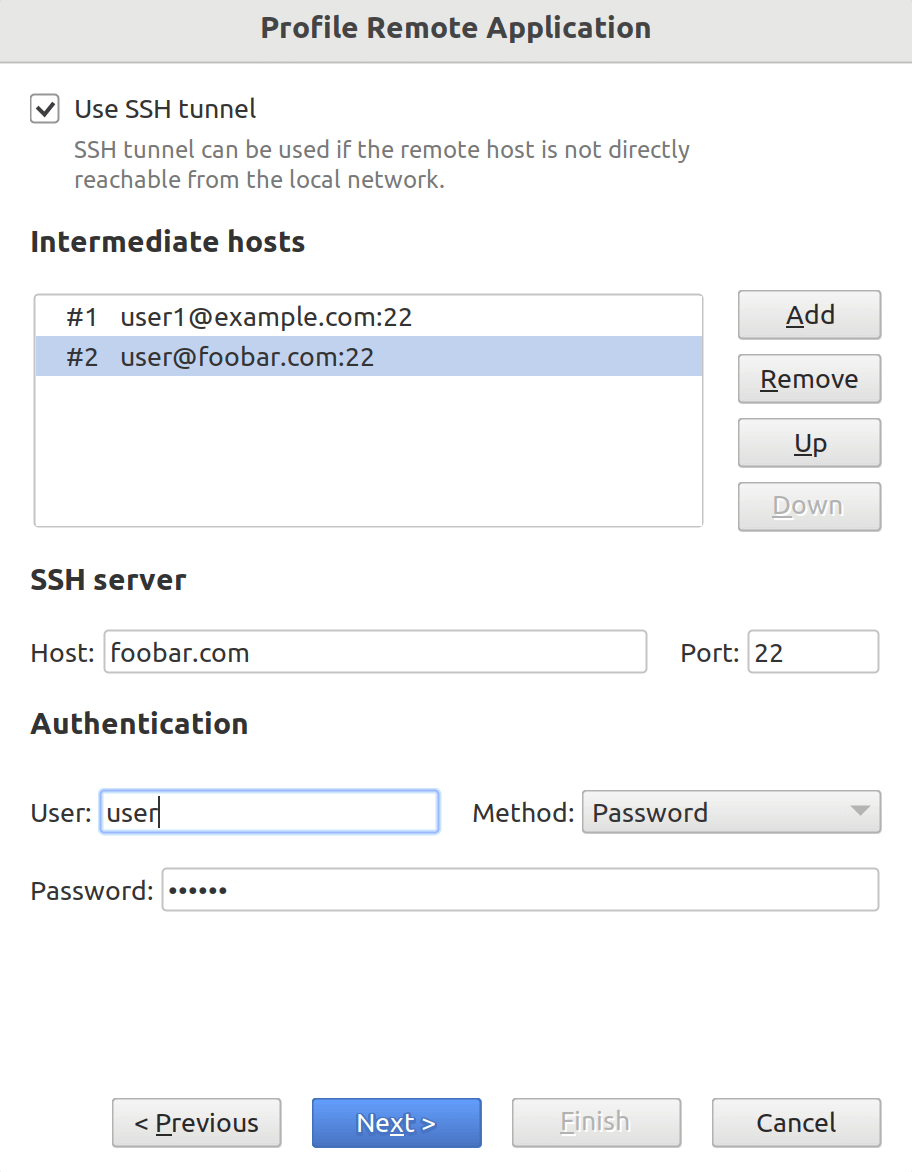
Build SSH tunnel
If the remote host is not directly reachable you can build SSH tunnel. To do so, navigate to the SSH Tunnel step and enable SSH tunnel using Use SSH tunnel checkbox.
You can add any number of intermediate hosts, and specify authentication credentials for each of them. Profiler supports password authentication, authentication with private SSH key, and through the SSH agent.
Intermediate hosts must have the same prerequisites as the host in SSH access mode.
4. Connect to the remote application
Created connection will appear in the "Monitor Applications" list on Welcome screen under a given name. You can then connect to the application to perform profiling.
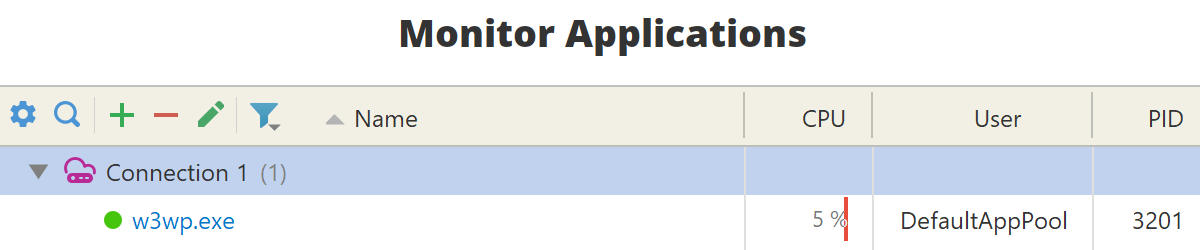
If you do not see your application it the list, please read profiling troubleshooting.