- System requirements
- Profiler architecture
- Profiler installation
- Uninstall profiler
- Running the profiler
- Profiler activation
- Welcome screen
- Start profiling
- IDE integration
- Profile .NET executable
- Profile ASP.NET application in IIS
- Profile ASP.NET web app on Azure App Service on Linux
- Profile ASP.NET web app on Azure App Service on Windows
- Profile all .NET processes that will start
- Attach profiler to a running application
- Profile remote applications
- Profiling in Docker container
- Manually enable profiling of local applications
- Agent startup options
- Connect to profiled application
- Profiling overhead
- Snapshots
- Solving performance problems
- CPU profiling
- Thread profiling
- Object allocation profiling
- Memory profiling
- Exception profiling
- Telemetry
- Probes: monitor higher level events
- Inspections: automatic recognition of typical problems
- Automatically trigger actions on event
- Automatic deobfuscation
- Summary, automatic deobfuscation
- Filters
- Profiler command line
- Command line tool to control profiling
- Export of profiling results to external formats
- Profiler .NET API
- Profiler HTTP API
- Settings
- Troubleshooting
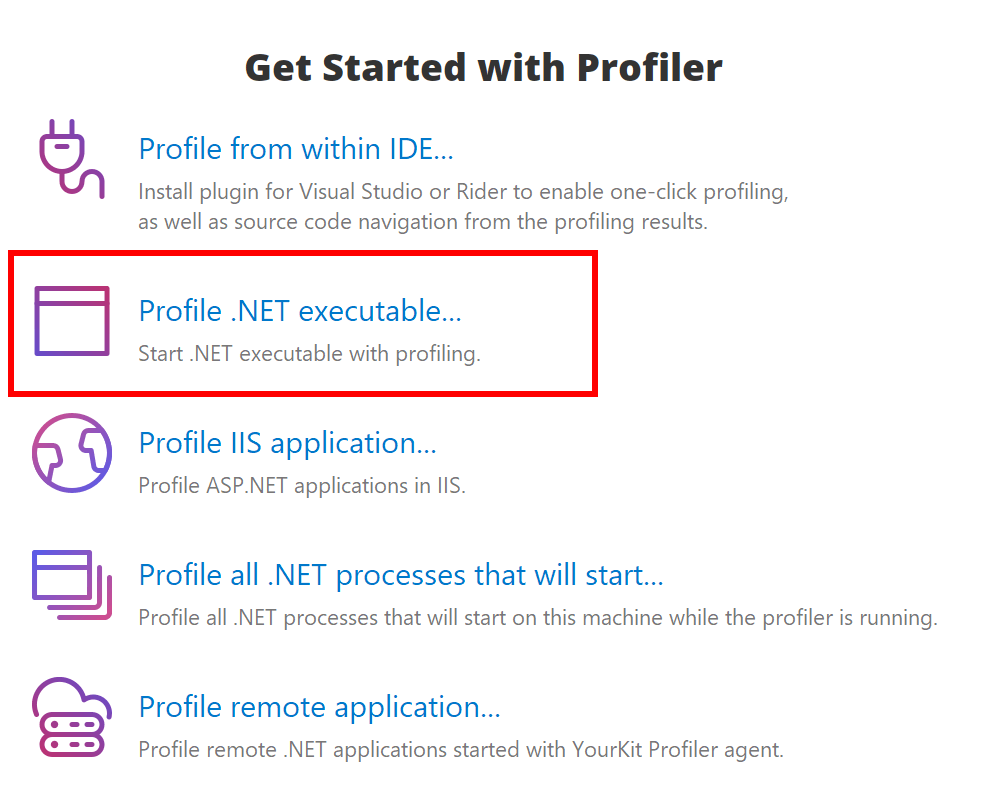
Profile .NET executable
In most cases you can profile your .NET application by launching its executable from the profiler UI.
1. Use Profile .NET executable... action on Welcome screen or in Profile menu. It allows you to specify executable path, command line arguments and working directory.
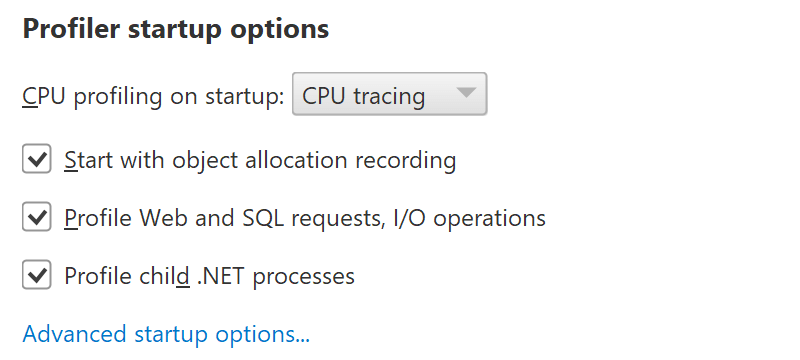
2. In the appeared dialog you can configure CPU profiling mode, enable object allocation profiling and events, and set any profiling option:
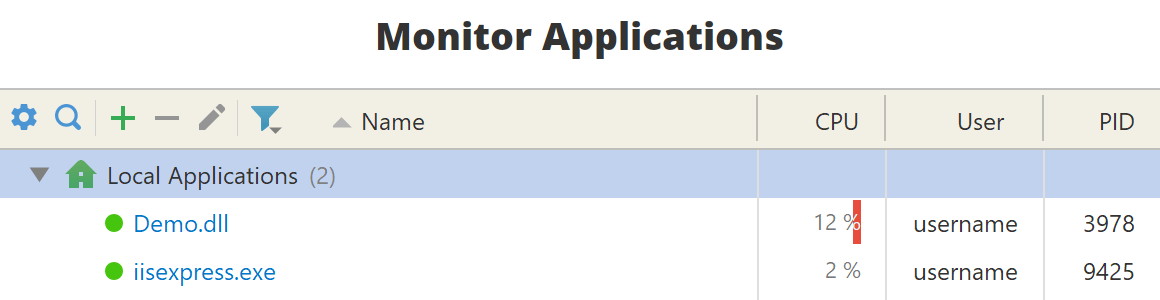
3. Choose profiling options and press Profile to launch the application. The profiler will automatically connect to it, and you will be able to obtain profiling results. It will also appear on the Welcome screen in Monitor Applications list.