- System requirements
- Profiler architecture
- Profiler installation
- Uninstall profiler
- Running the profiler
- Profiler activation
- Welcome screen
- Start profiling
- IDE integration
- Profile .NET executable
- Profile ASP.NET application in IIS
- Profile ASP.NET web app on Azure App Service on Linux
- Profile ASP.NET web app on Azure App Service on Windows
- Profile all .NET processes that will start
- Attach profiler to a running application
- Profile remote applications
- Profiling in Docker container
- Manually enable profiling of local applications
- Agent startup options
- Connect to profiled application
- Profiling overhead
- Snapshots
- Solving performance problems
- CPU profiling
- Thread profiling
- Object allocation profiling
- Memory profiling
- Exception profiling
- Telemetry
- Probes: monitor higher level events
- Inspections: automatic recognition of typical problems
- Automatically trigger actions on event
- Automatic deobfuscation
- Summary, automatic deobfuscation
- Filters
- Profiler command line
- Command line tool to control profiling
- Export of profiling results to external formats
- Profiler .NET API
- Profiler HTTP API
- Settings
- Troubleshooting
Connect to profiled application
Once the profiled application is running, you should connect to it to obtain and analyze profiling results.
All detected .NET applications are shown in the Monitor Applications list on Welcome screen. Connect to the application you want to profile by clicking on its name.
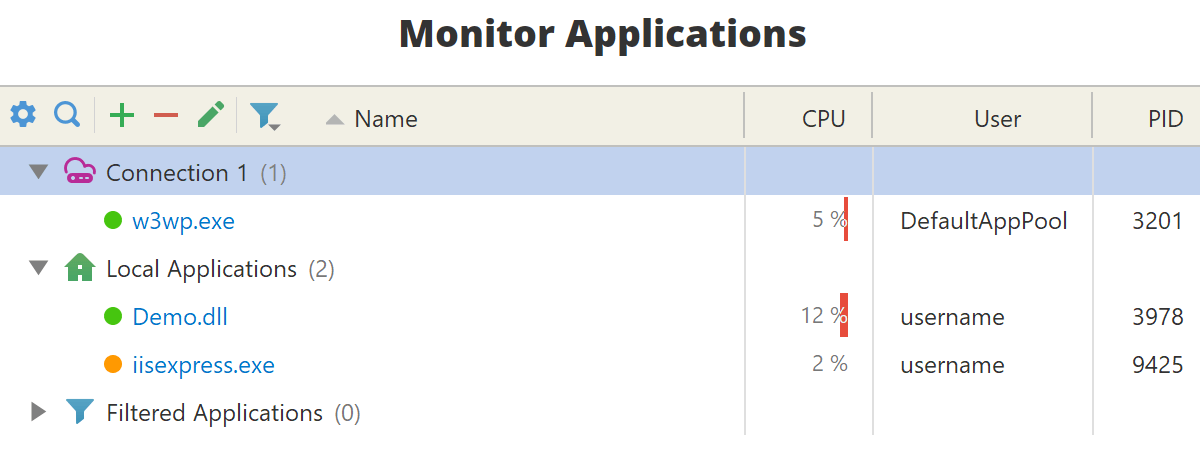
The colored circle indicates the profiler agent status in the CLR process. Green circle means the agent has been loaded, and the connection will happen immediately. Orange circle means the agent has not been loaded yet, and the profiler will automatically attach the agent before connection.
Local applications are shown under the node with  icon.
Applications running on the remote machines are shown under their own nodes with
icon.
Applications running on the remote machines are shown under their own nodes with  icon.
To add a new remote machine click
icon.
To add a new remote machine click  .
See Profile remote applications to learn more.
.
See Profile remote applications to learn more.
Profiler hides development tools, such as IDEs, in the list by default.
This can be configured by clicking on the  icon.
icon.
If you do not see your application it the list, please read profiling troubleshooting.
Profiling session
After a connection is established, the profiling session tab opens. It displays various profiler views and the toolbar to control profiling modes.
| Toolbar button | Description |

|
Capture performance snapshot - save the profiling results to a file, for comprehensive analysis |


|
Control CPU profiling |


|
Control thread profiling |

|
Capture memory snapshot |


|
Object allocation profiling controls |

|
Force garbage collection in the profiled application |


|
Exception profiling controls |

|
Triggers - configure actions automatically performed on events |


|
Control telemetry collection |

|
Pause - stop/start receiving data from profiled application |

|
Refresh - immediately receive profiling data from the profiled application and update the views |

|
Download snapshots during remote profiling |
You can close the profiling session tab by using File | Close Profiling Session.
You can connect to and disconnect from the profiled application as many times as you wish during its run time.