- System requirements
- Profiler architecture
- Profiler installation
- Uninstall profiler
- Running the profiler
- Profiler activation
- Welcome screen
- Start profiling
- IDE integration
- Profile .NET executable
- Profile ASP.NET application in IIS
- Profile ASP.NET web app on Azure App Service on Linux
- Profile ASP.NET web app on Azure App Service on Windows
- Profile all .NET processes that will start
- Attach profiler to a running application
- Profile remote applications
- Profiling in Docker container
- Manually enable profiling of local applications
- Agent startup options
- Connect to profiled application
- Profiling overhead
- Snapshots
- Solving performance problems
- CPU profiling
- Thread profiling
- Object allocation profiling
- Memory profiling
- Exception profiling
- Telemetry
- Probes: monitor higher level events
- Inspections: automatic recognition of typical problems
- Automatically trigger actions on event
- Automatic deobfuscation
- Summary, automatic deobfuscation
- Filters
- Profiler command line
- Command line tool to control profiling
- Export of profiling results to external formats
- Profiler .NET API
- Profiler HTTP API
- Settings
- Troubleshooting
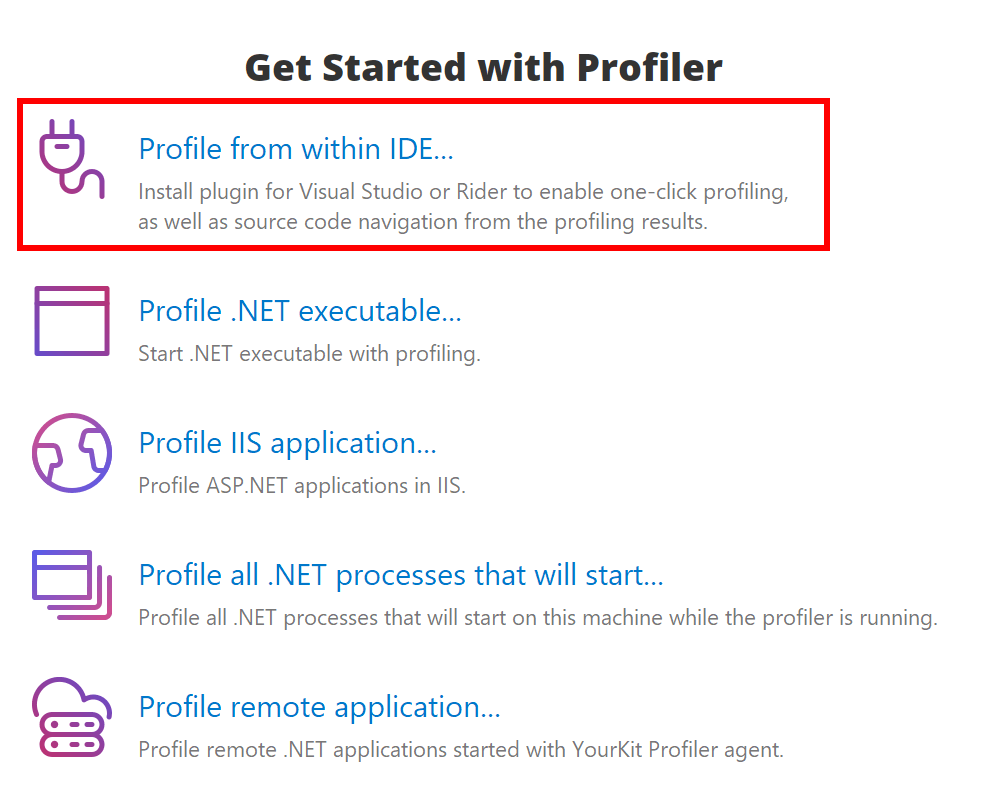
IDE integration
IDE integration provides ability to profile a .NET application directly from IDE and easy navigation from profiling results to the application source code.
IDE integration wizard
YourKit provides plugins for Visual Studio and Rider. To install the plugin, use Profile from within the IDE... action on Welcome screen or in Profile menu.