- System requirements
- Profiler architecture
- Profiler installation
- Uninstall profiler
- Running the profiler
- Profiler activation
- Welcome screen
- Start profiling
- IDE integration
- Profile .NET executable
- Profile ASP.NET application in IIS
- Profile ASP.NET web app on Azure App Service on Linux
- Profile ASP.NET web app on Azure App Service on Windows
- Profile all .NET processes that will start
- Attach profiler to a running application
- Profile remote applications
- Profiling in Docker container
- Manually enable profiling of local applications
- Agent startup options
- Connect to profiled application
- Profiling overhead
- Snapshots
- Solving performance problems
- CPU profiling
- Thread profiling
- Object allocation profiling
- Memory profiling
- Exception profiling
- Telemetry
- Probes: monitor higher level events
- Inspections: automatic recognition of typical problems
- Automatically trigger actions on event
- Automatic deobfuscation
- Summary, automatic deobfuscation
- Filters
- Profiler command line
- Command line tool to control profiling
- Export of profiling results to external formats
- Profiler .NET API
- Profiler HTTP API
- Settings
- Troubleshooting
Attach profiler to a running application
Attach technique allows loading the profiler agent into running .NET runtime. In spite of its simplicity and convenience, attaching has several limitations in functionality, that is why it is preferred when profiler agent is loaded into .NET runtime on application startup.
Attaching from profiler UI
All detected running .NET processes are shown in the Monitor Applications list on Welcome screen. The colored circle indicates the profiler agent status. When the agent is already loaded, the circle is green. Orange circle shows that agent is not yet loaded but can be attached.
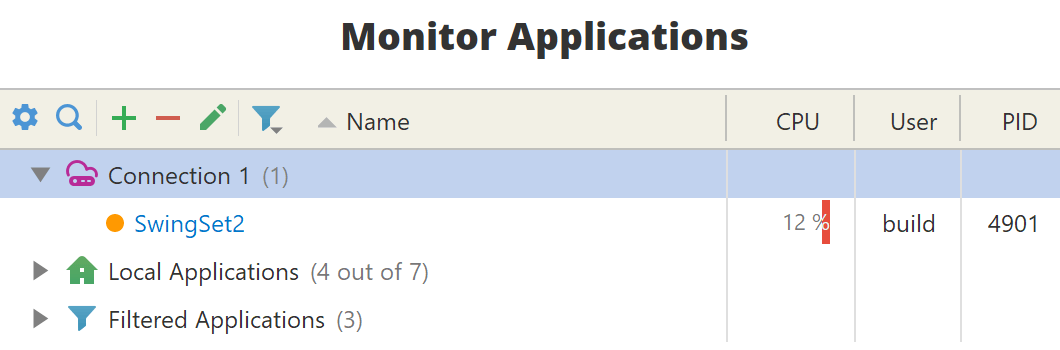
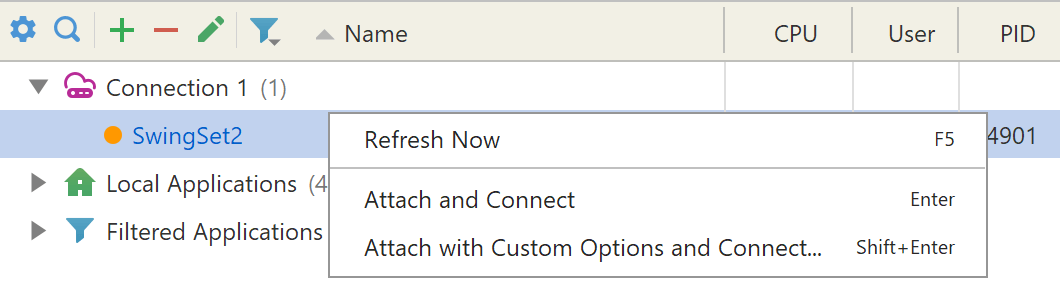
Attach to the application you want to profile by clicking on its name. Attach from context menu to provide custom agent options.
Attaching is possible to both local and remote applications.
Local applications are shown under the node with  icon.
Applications running on the remote machines are shown under their own nodes with
icon.
Applications running on the remote machines are shown under their own nodes with  icon.
To add a new remote machine click
icon.
To add a new remote machine click  .
See remote profiling from user interface
to learn more.
.
See remote profiling from user interface
to learn more.
If you do not see your application it the list, please check troubleshooting and FAQ.
Attach from command line
Run the command line tool to attach profiler agent and then connect from Welcome screen.
Attach mode limitations
Not all profiling capabilities are available in the attach mode due to .NET runtime limitations listed below. To get all capabilities, application should be started with the profiler.
- Memory profiling is disabled for applications running in concurrent GC mode. Read this MSDN article to learn how to avoid using concurrent GC mode.
-
Some threads started before attach will not be shown.
In particular, they will not be seen in the
thread states view and in
CPU sampling results.
To make the threads appear,
you may try to explicitly force garbage collection via
 toolbar button.
- Object allocation profiling is disabled.
- CPU tracing is not available in .NET Framework applications.
- Exception profiling is not available in .NET Framework applications.
-
If you experience crashes attaching to a
ReadyToRun (R2R)
application, use agent option
disable_all. Alternatively, disable R2R feature by setting application's environment variableDOTNET_ReadyToRun=0. -
Applications on .NET 9 and above may crash in attach mode. To avoid this, use agent option
disable_all. Alternatively, disable tiered compilation by setting application's environment variableDOTNET_TieredCompilation=0.
In .NET runtime only one profiler agent can be loaded at a time.
This means that attach will fail, if another profiler agent is
already loaded. To avoid a profiler conflict, please
make sure, that the environment variables COR_PROFILER
and CORECLR_PROFILER are not set.