- System requirements
- Profiler architecture
- Profiler installation
- Uninstall profiler
- Running the profiler
- Profiler activation
- Welcome screen
- Start profiling
- Profiling overhead
- Snapshots
- Solving performance problems
- CPU profiling
- Thread profiling
- Object allocation profiling
- Memory profiling
- Exception profiling
- Telemetry
- Probes: monitor higher level events
- Inspections: automatic recognition of typical problems
- Automatically trigger actions on event
- Automatic deobfuscation
- Summary, automatic deobfuscation
- Filters
- Profiler command line
- Command line tool to control profiling
- Export of profiling results to external formats
- Profiler .NET API
- Profiler HTTP API
- Settings
- Troubleshooting
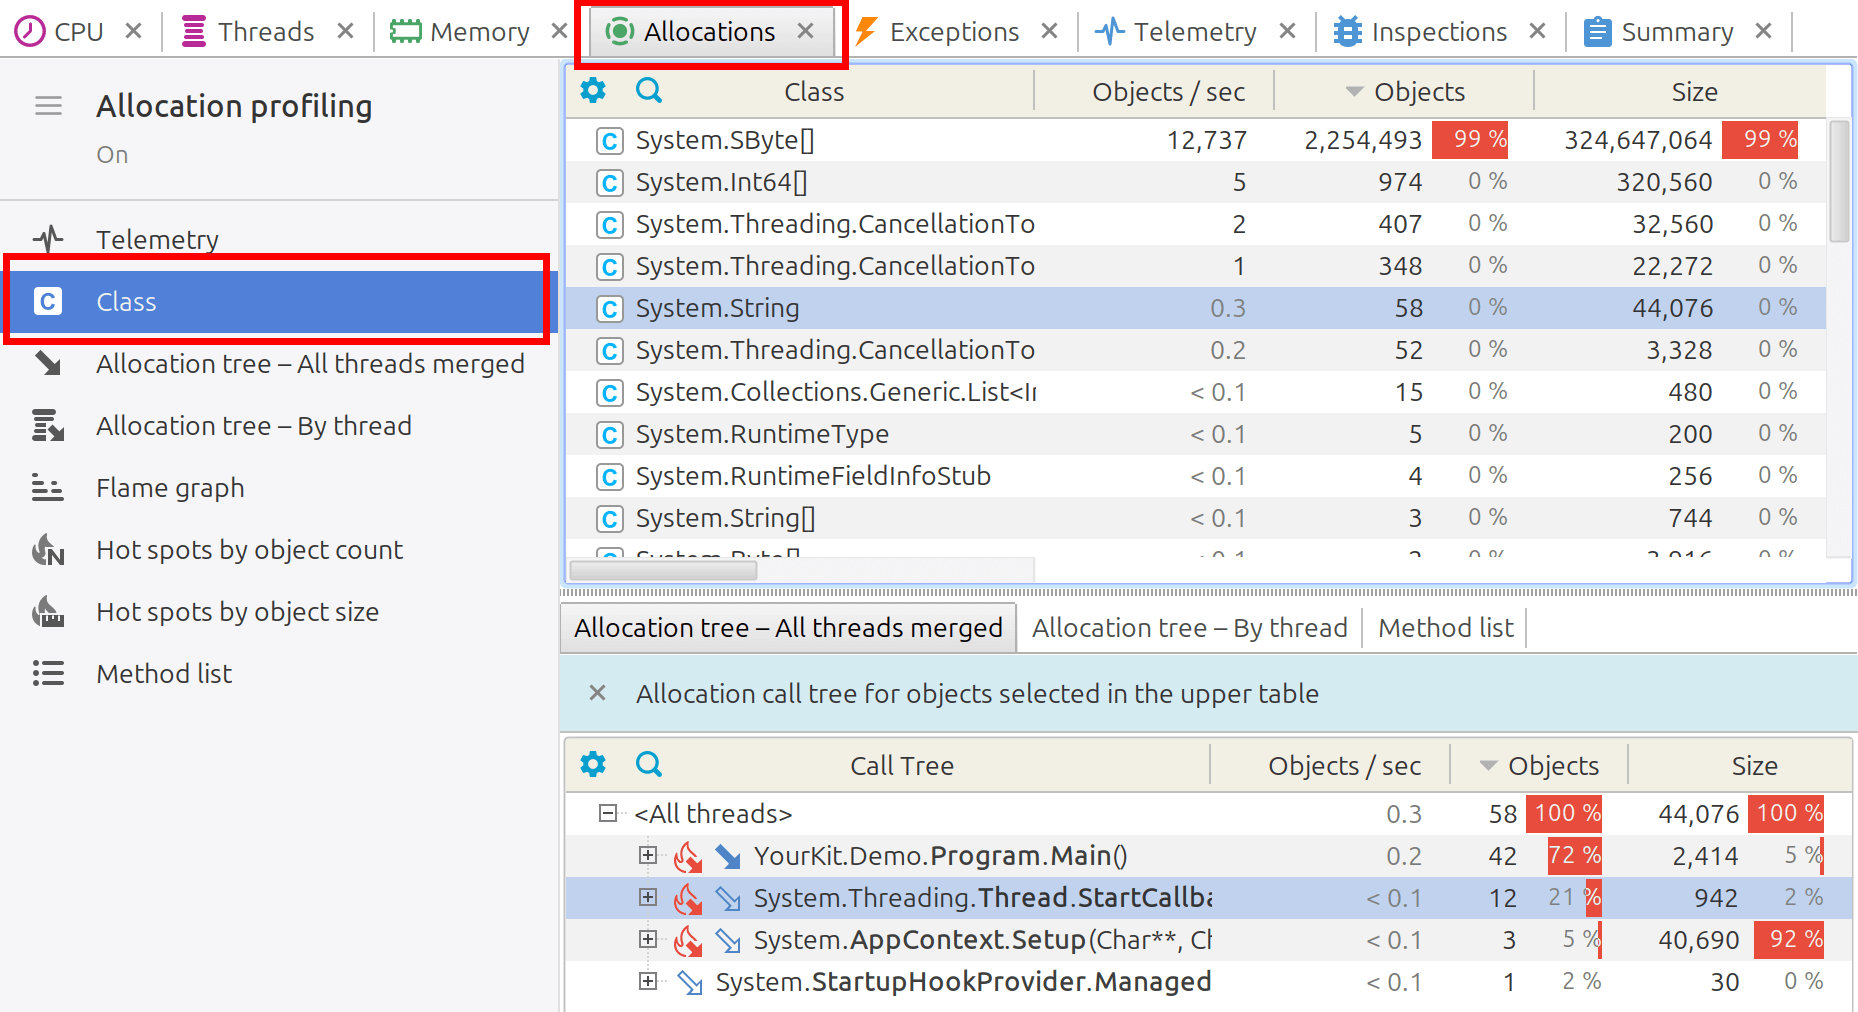
Allocation class
Class view groups allocated objects by their class. Each row represents a specific class whose objects have been allocated during profiling. When a class is selected in the main table, the related call tree or method list is displayed in the secondary views below, offering detailed insights into where the objects were allocated. This helps identify the methods and stack traces responsible for these allocations.
Columns
- Class – The class name of allocated objects.
- Objects / sec – The average number of objects allocated per second, indicating allocation intensity.
- Objects – The total number of allocated objects of this class.
- Size – The total memory occupied by allocated objects of this class.