- System requirements
- Profiler architecture
- Profiler installation
- Uninstall profiler
- Running the profiler
- Profiler activation
- Welcome screen
- Start profiling
- Profiling overhead
- Snapshots
- Solving performance problems
- CPU profiling
- Thread profiling
- Telemetry
- Thread states
- Frozen threads
- Object allocation profiling
- Memory profiling
- Exception profiling
- Telemetry
- Probes: monitor higher level events
- Inspections: automatic recognition of typical problems
- Automatically trigger actions on event
- Automatic deobfuscation
- Summary, automatic deobfuscation
- Filters
- Profiler command line
- Command line tool to control profiling
- Export of profiling results to external formats
- Profiler .NET API
- Profiler HTTP API
- Settings
- Troubleshooting
Thread states
Knowing the state distribution of threads over time can highlight concurrency issues, such as deadlocks or excessive waiting, impacting the application's performance. It helps to understand how threads interact with each other and with system resources.
Thread state timeline
Timeline view of thread states shows a list of threads on the left
with corresponding bars indicating their state over time on the right.
Each bar is color-coded: running states are in green,
waiting states are in yellow.
Superimposed on these bars are flame
 icons representing the samples with high CPU usage.
The rightmost CPU time column lists the cumulative CPU time for each thread,
giving you a clear indication of which threads are consuming the most resources.
icons representing the samples with high CPU usage.
The rightmost CPU time column lists the cumulative CPU time for each thread,
giving you a clear indication of which threads are consuming the most resources.
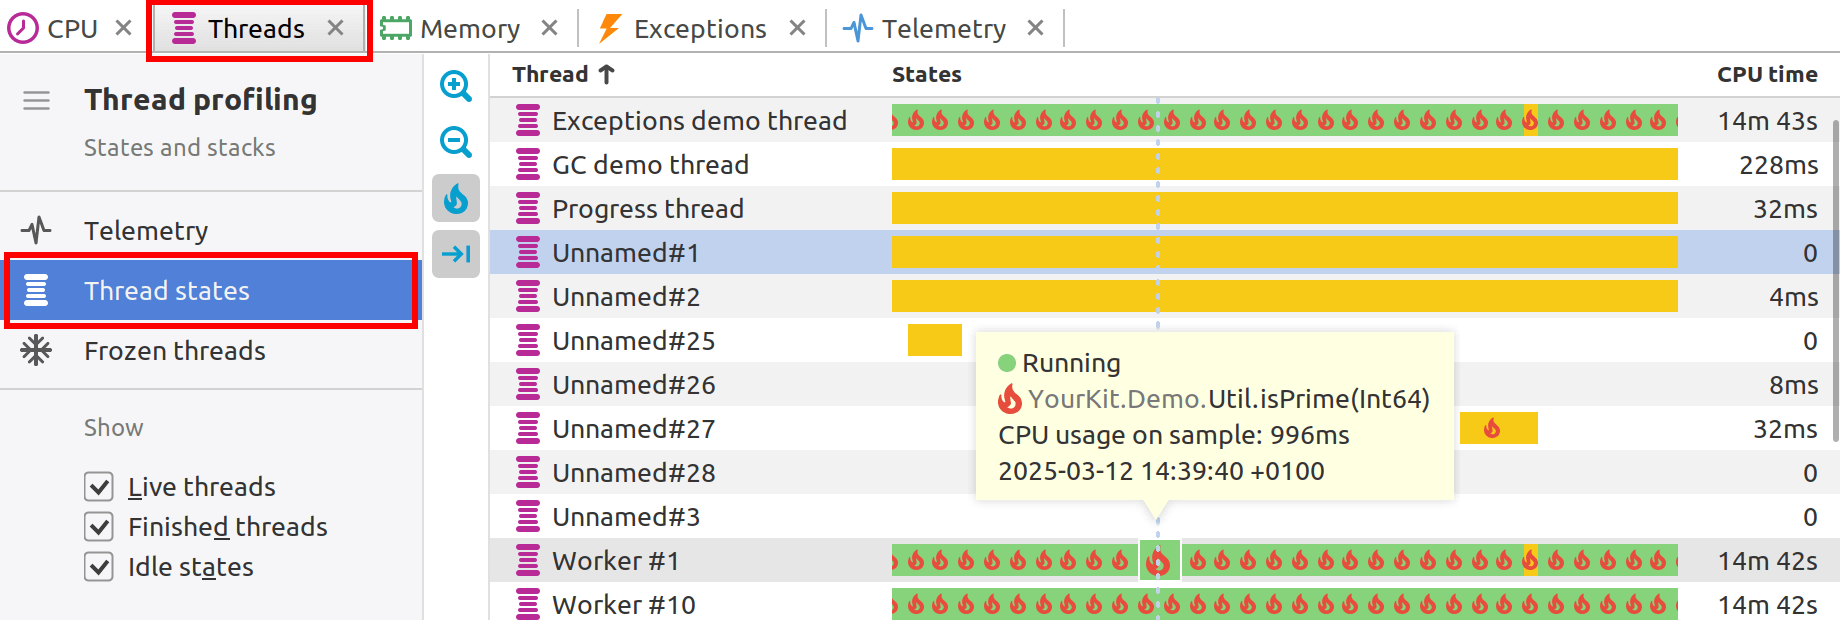
A tooltip appears upon mouse hover over individual thread activity bars, providing detailed information about the sample including timestamp, CPU time, the thread's state and top method on the stack, if stacks were recorded.
At the bottom of the States column, there is a time range selector. This interactive feature allows you to adjust the scale of the timeline for a more granular or broader view and to select a specific time region to display. This can help to focus on time intervals of interest, to examine thread behavior and system performance within that period more closely.
Timeline toolbar
-

 :
Zoom in and out to quickly change the range of visible data.
:
Zoom in and out to quickly change the range of visible data.
-
 :
Highlight the hot spot samples with high CPU usage using the flame icon.
:
Highlight the hot spot samples with high CPU usage using the flame icon.
-
 :
Control auto-scrolling behavior.
When toggled, the timeline will be automatically scrolled to the right when new data arrives.
:
Control auto-scrolling behavior.
When toggled, the timeline will be automatically scrolled to the right when new data arrives.
Timeline filtering
YourKit .NET Profiler provides a comprehensive set of tools for filtering profiling results. With these advanced filtering options, you can isolate and examine specific threads, methods, and states for a more targeted and efficient debugging process.
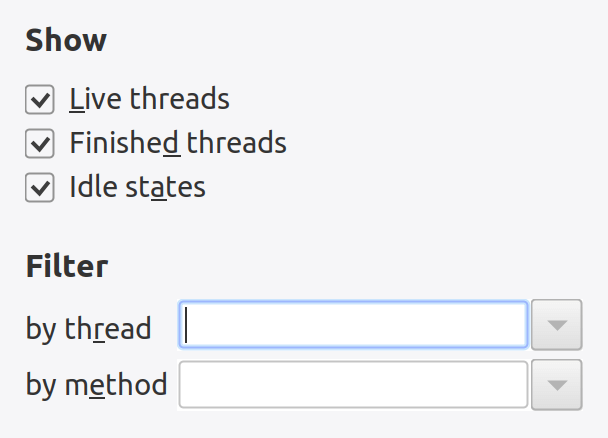
Live threads: These are the threads that are currently active and running in your .NET application.
Finished threads: These threads have completed their execution. They are no longer active in the .NET runtime. Tracking finished threads can be useful to understand past activity and to ensure that threads are completing as expected.
Idle states: This shows the thread states where the CPU is not being consumed. Threads in wait, sleep, or other non-active states will be shown when this option is enabled. This can be particularly useful when you want to focus on threads that are not using CPU resources and might be waiting on I/O operations, locks, or other conditions.
Filter by thread: This allows you to narrow down the thread view to only those that match a certain name or naming pattern. It's helpful when you are interested in specific threads, such as those associated with a particular part of your application.
Filter by method: This filter will show you the states where a particular method is in the stack trace. If a thread's execution has passed through the specified method, it will be displayed. This is useful for drilling down into how specific methods affect thread states and performance.
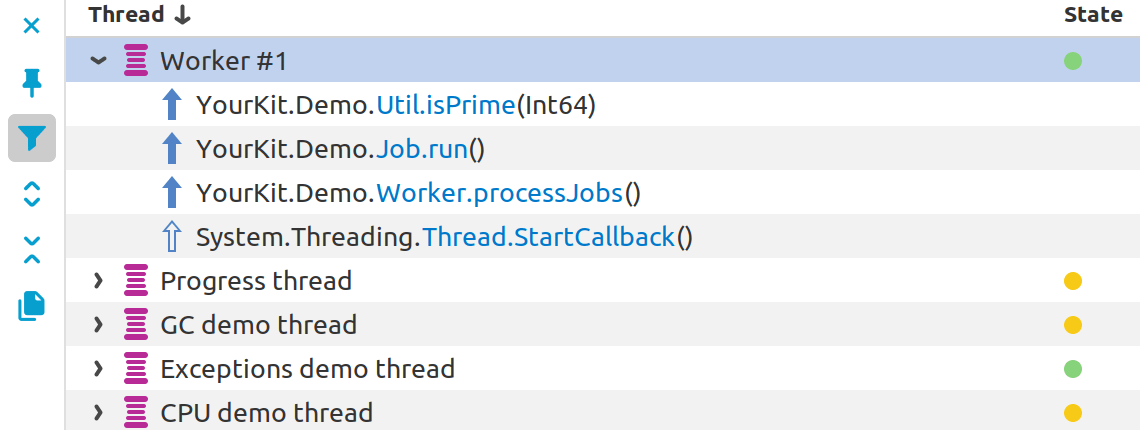
Thread stacks
If stacks were recorded, selecting a single sample or a time range allows you
to display the stack trace at a specific point in time or estimate CPU usage
for the selected range. However, unlike other telemetry views,
this can be done on a per-thread basis using the  toolbar button.
Stacks toolbar
-
 :
Clear timeline selection.
:
Clear timeline selection.
-
:
Only show thread selected on the thread state timeline.
-
 :
Apply filters to stacks.
:
Apply filters to stacks.
-
 :
Expand all threads to show stacks.
:
Expand all threads to show stacks.
-
 :
Collapse all threads to hide stacks.
:
Collapse all threads to hide stacks.
-
 :
Copy all stack traces.
:
Copy all stack traces.