- System requirements
- Profiler architecture
- Profiler installation
- Uninstall profiler
- Running the profiler
- Profiler activation
- Welcome screen
- Start profiling
- Profiling overhead
- Snapshots
- Solving performance problems
- CPU profiling
- Thread profiling
- Object allocation profiling
- Memory profiling
- Exception profiling
- Telemetry
- Probes: monitor higher level events
- Inspections: automatic recognition of typical problems
- Automatically trigger actions on event
- Automatic deobfuscation
- Summary, automatic deobfuscation
- Filters
- Profiler command line
- Command line tool to control profiling
- Export of profiling results to external formats
- Profiler .NET API
- Profiler HTTP API
- Settings
- Troubleshooting
Event inspections
See also Memory inspections
Typical behavioral problems can be recognized with the help of the "Inspections" feature. Inspections enable automatic high-level analysis of probe results. Each inspection automatically detects a specific issue. Performing this type of analysis by hand would be a very complicated (if at all possible) task.
With the help of inspections you can easily find the causes and possible solutions of usual problems.
The feature is presented with "Inspections" view.
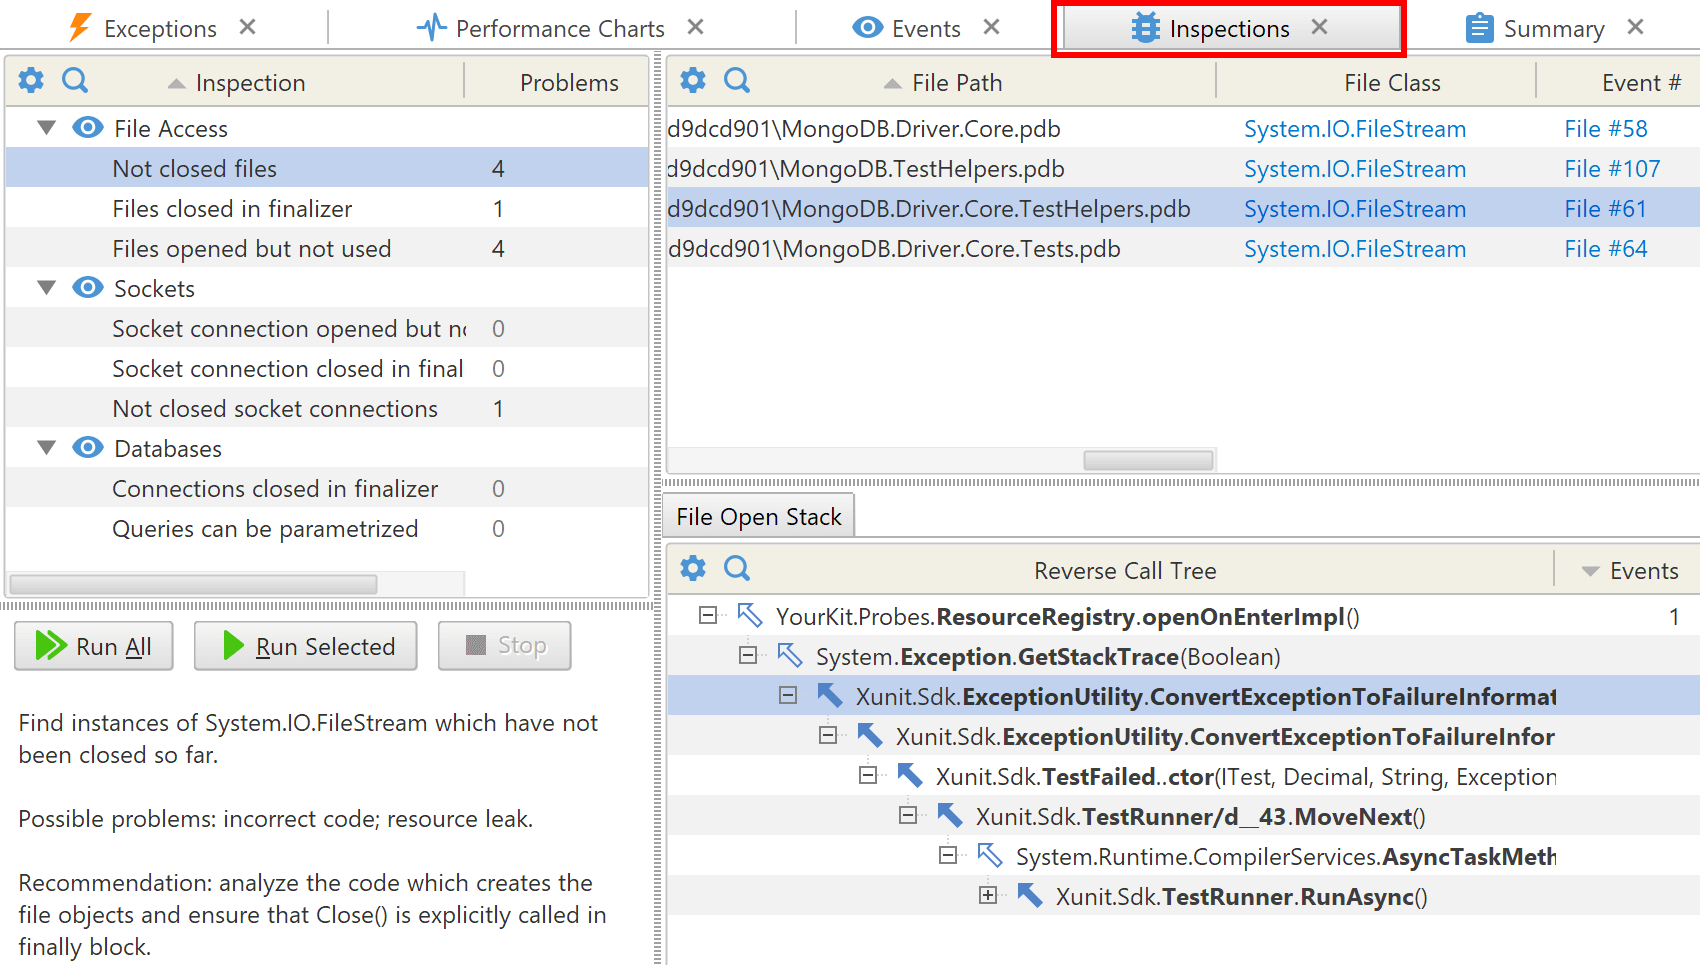
(1) To run all inspections as a batch use "Run All Inspections" button.
(2) To run a single inspection, select it in the tree and use "Run This Inspection Only" button
(this is especially useful if you want to apply the changes made to an inspection's options).