Changes in version 2017.02
User interface
-
New feature: ability to expand particular filtered branches in call tree views.
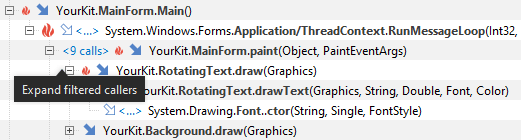
Expansions of filtered calls can be undone one by one by using the popup menu action "Undo" or Ctrl+Z.
- New action "Show File in Explorer" superseded previously existing action "Open Containing Folder". This new action not only opens corresponding directory in the OS-specific file manager, but also selects the target file in it.
- Native thread ID is now shown as a decimal number instead of hex, which makes them compatible with thread IDs as seen in system logs, Task Manager and other similar tools.
CPU profiling
-
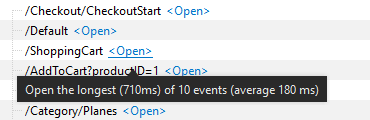
Call tree view directly shows web and database events under the method call where they happened.
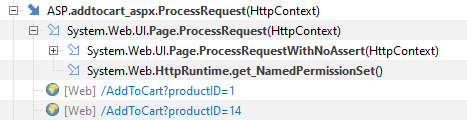
You can open the longest individual event by clicking the hyperlink. As the result, the event will reveal in "Events".
- CPU tracing result accuracy increased in some corner cases thanks to improved time measurement algorithms
-
New feature: higher-level profiling of MongoDB database. MongoDB request information is available in:
- "High-level statistics" view, "Database" section
- "Events" tab
- "Performance Charts" tab
- Action "CPU | View Method By Name..." (Ctrl+Shift+N): currently selected method is now preselected in the chooser popup
-
Own time column in call tree views was removed as redundant.
To return it specify
-Dyk.own.time.column=truein<user home>/.ynp/ui.ini.
Memory profiling
- Optimization: up to 30% improvement of memory snapshot loading time on multiprocessor machines
-
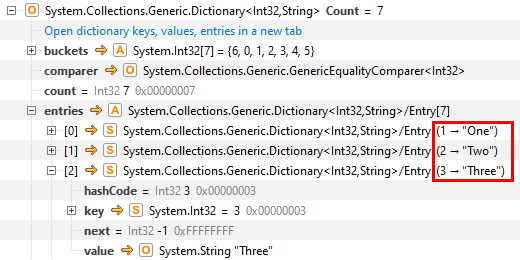
Object explorer: key and value are immediately shown for dictionary entries. Also, the action "Open dictionary keys, values, entries in a new tab" available for dictionary objects now offers to open entries by default.
-
Object explorer: class-specific object presentation:
System.Drawing.Colorsupported: color components (red/green/blue/alpha) as well as the color itself are presented -
Object explorer:
collection size is immediately shown and the action
Memory | Contained Objectsis available for more classes: classes fromSystem.Collections.Concurrentnamespace, read-only and synchronized wrappers,System.Collections.Generic.SortedSet,System.Collections.Generic.SortedDictionary -
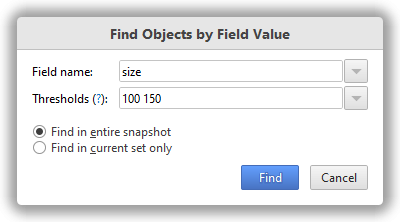
New action "Memory | Objects by Field Value... (Ctrl+Shift+F)" opens in a new tab objects having particular field values. This allows to find objects of interest among e.g. many other instances of a class. You can specify the field name and exact value or its minimum and maximum value limits. The action can work with all snapshot objects or with objects presented in a current tab.
-
Object allocation recording: toolbar has new button to clear recorded object allocations and continue recording

- Object allocation recording: action "Memory | View Method By Name..." (Ctrl+Shift+N): currently selected method is now preselected in the chooser popup
-
New inspection "Inefficient primitive data type usage" finds situations when unnecessarily large primitive data type is used to store values that might fit a smaller data type instead, e.g. when
longis used instead ofint, orintinstead ofbyte. Such usage might result in memory waste. The inspection analyzeslong,int,shortas well aslong[],int[],short[]instance fields per class, as well as standalonelong[],int[],short[]arrays.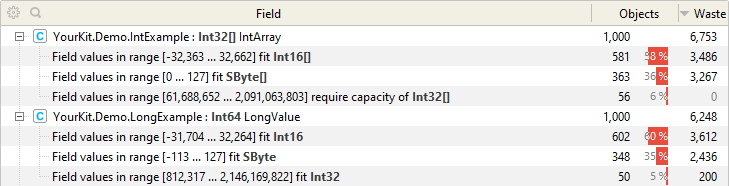
-
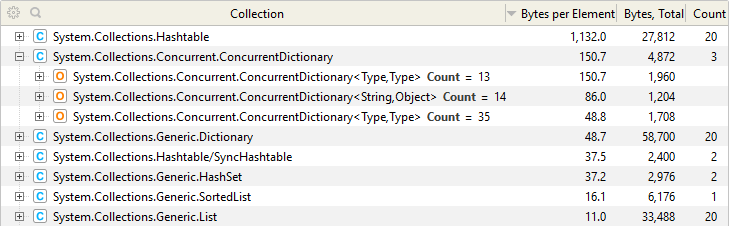
New inspection "Collections with biggest storage overhead" finds collections with biggest memory usage overhead of storing their elements.
-
Memory inspection "Dictionary hash code distribution" inspection:
added support of
ConcurrentDictionaryandHashtable -
If the property
-Dyk.tmp.dir=<directory>is specified it is also respected while calculating the dominator tree which is performed when a memory snapshot is being loaded
Telemetry
-
Threads view reworked, now shows events alongside thread states
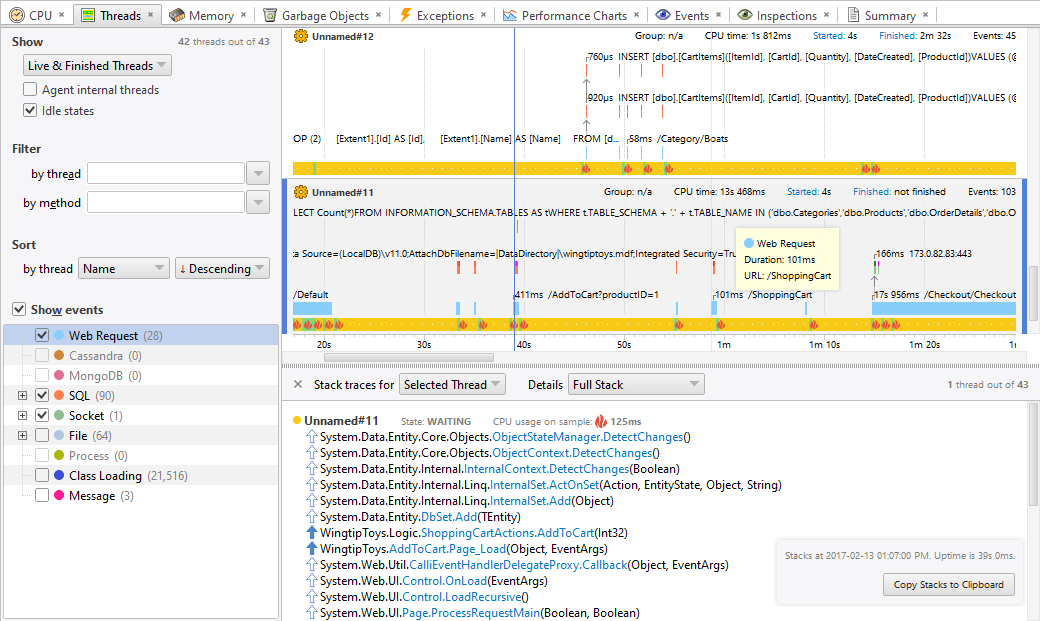
- Threads view: "Started" property shows when particular thread started. Sort by this property to present threads in the order of their appearance.
- Threads view: "Ended" property shows whether particular thread ended, and if it did, when. Sort by this property to present threads in the order of their termination.
-
New feature: ability to export telemetry graph to
.png. You can export entire graph or only its visible part. When exporting a wide graph you have an option to split it to pieces of arbitrary width to limit the resulting image width.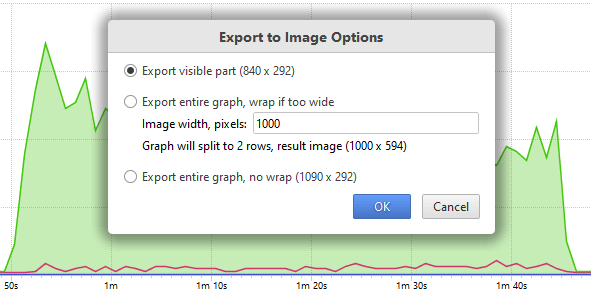
-
New feature: ability to clear the telemetry charts. There is a new toolbar button (3rd from the right), new profiler API method
YourKit.Profiler.Api.ClearCharts().
-
Scalability improvement:
the stack traces panel shown on clicking a telemetry graph could take much time to appear or update
for a hugh number of threads (hundreds or thousands), leading to a freezing UI.
To tackle this problem the number of shown threads in the stack traces panel is now by default limited to 300.
If the limit is reached, please apply the thread filter in the UI to see particular threads only,
or increase the limit by specifying
-Dyk.thread.count.limit=<custom limit>in<user home>/.ynp/ui.ini.
Event recording with probes
-
"High-level statistics" view: added ability to open the longest event in "Events"
-
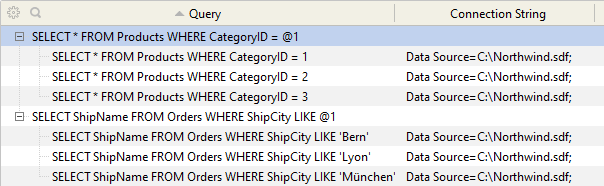
New inspection "Queries can be parametrized" finds similar SQL queries that can potentially be optimized by using SQL parameters
Miscellaneous
- Windows installer: the version of NSIS was upgraded to improve user experience on latest Windows versions
- Windows installer: improved diagnostics of insufficient disk space on target drive
-
Windows: the profiler agent library
ynpagent.dllis digitally signed. - Export: size of generated HTML files significantly reduced
- Remote profiling: bug fixed: the profiler did not detect situations when the profiled application quickly restarted and continued to listen on the same agent port, erroneously treating the profiling results coming from the new instance as belonging to the old instance. This might cause different sorts of data inconsistencies and errors in UI.
- Optimization: snapshot loading speed was greatly improved for performance snapshots
- Other bug fixes