
- System requirements
- Profiler architecture
- Profiler installation
- Uninstall profiler
- Running the profiler
- Profiler activation
- Welcome screen
- Start profiling
- Profiling overhead
- Snapshots
- Solving performance problems
- CPU profiling
- Thread profiling
- Virtual threads support
- Object allocation profiling
- Memory profiling
- Monitor profiling
- Exception profiling
- Telemetry
- Probes: monitor events of various kinds
- Inspections: automatic recognition of typical problems
- Automatically trigger actions on event
- Automatic deobfuscation
- Summary
- Filters
- Profiler command line
- Export of profiling results to external formats
- Profiler Java API
- Profiler HTTP API
- Settings
- Troubleshooting and FAQ
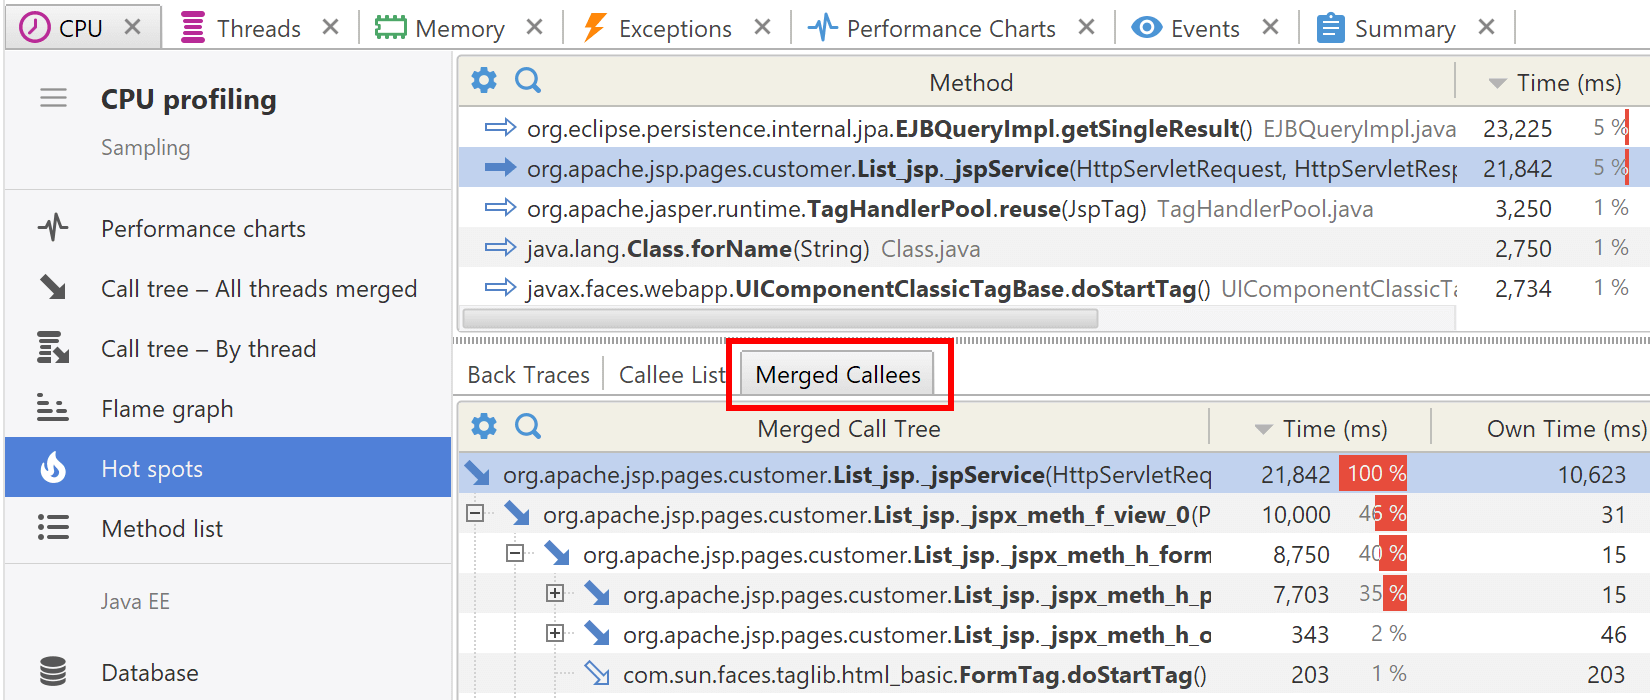
Method merged callees view
This view shows merged callees for a particular method, i.e. all call traces started from this method. This gives a summary of method execution and its "overall" behavior. CPU | Method Merged Callees (Ctrl+M) menu action opens the view for the selected method.
For each method you will see execution time and number of invocations if available.
Actions
The following actions are available in the popup menu:
- CPU | Method Merged Callees (Ctrl+M) - shows the method's merged callees.
- CPU | Method Back Traces (Ctrl+Shift+M) - shows the method's back traces.
- Tools | Open in IDE (F7) - opens method declaration in IDE editor. See IDE integration.