- System requirements
- Profiler architecture
- Profiler installation
- Uninstall profiler
- Running the profiler
- Profiler activation
- Welcome screen
- Start profiling
- Profiling overhead
- Snapshots
- Solving performance problems
- CPU profiling
- Thread profiling
- Virtual threads support
- Object allocation profiling
- Memory profiling
- Monitor profiling
- Exception profiling
- Telemetry
- Probes: monitor events of various kinds
- Inspections: automatic recognition of typical problems
- Automatically trigger actions on event
- Automatic deobfuscation
- Summary
- Filters
- Profiler command line
- Export of profiling results to external formats
- Profiler Java API
- Profiler HTTP API
- Settings
- Troubleshooting and FAQ
Call counting
Call counting is the most lightweight CPU profiling mode among all that YourKit Java Profiler provides to measure performance of the Java applications.
It involves measuring the number of times a particular method or function is called within the program's execution. Call counting can provide valuable insights into how often specific parts of code are executed, which can be useful for optimizing performance, identifying bottlenecks, and understanding application behavior.
There are various scenarios where using call counting might be more appropriate than CPU sampling or CPU tracing:
1. Identifying high-frequency methods: Call counting excels at identifying which methods are being called most frequently. If you are trying to optimize an application, knowing which methods are called most often can be more valuable than knowing which methods are using the most CPU time.
2. Focused analysis: If you already have an idea of which methods might be problematic and want to confirm your suspicions without the overhead of full tracing or sampling, call counting can provide a focused view on the methods of interest.
3. Minimal overhead requirement: If the system being profiled cannot tolerate the overhead of CPU tracing, and even the lighter overhead of CPU sampling is too much, call counting might be the best option. It involves only incrementing a counter and is usually the least intrusive of the three approaches.
4. Profiling in production environments: Sometimes, you might want to gather performance data from a production environment where it's crucial to minimize the impact on performance. In such cases, the low overhead of call counting makes it an attractive option.
5. Long-running processes: For long-running processes or Java applications with a large number of method calls, the accumulated data from CPU tracing might become overwhelming and difficult to analyze. Call counting can give you a more digestible summary of method call frequencies.
6. Intermittent issues: If your application has intermittent performance issues, CPU sampling might miss short-lived problems that occur between samples. Call counting can give you a clearer picture of method call frequencies over time.
Performance impact
Call counting does not capture call stacks or CPU time, but it allows us to see which methods are called most frequently. Since it only involves incrementing a counter, the overhead is minimal compared to other CPU profiling methods.
Remember, this technique can still have some overhead, especially if the counter is incremented in very frequently called methods. However, it's less invasive than full tracing and can provide valuable information for performance optimization.
Call counting settings
Call counting will be completely disabled if
disable_tracing or
disable_all
agent startup option is specified.
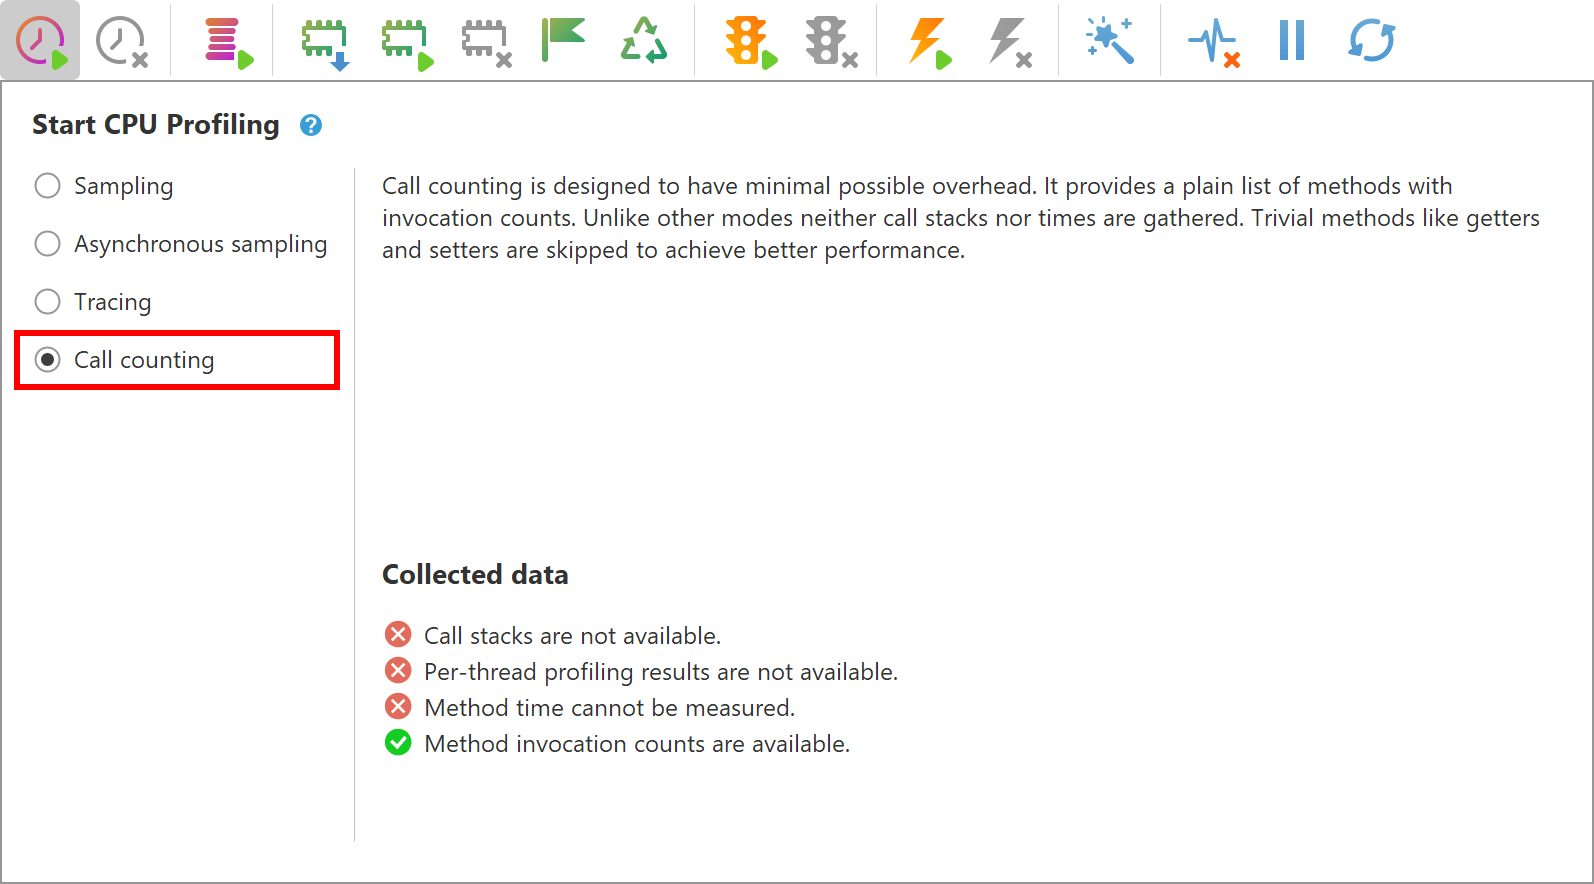
Start call counting
To start call counting, please click
 button in the profiler toolbar, and choose
Call counting option in the
drop-down pane:
button in the profiler toolbar, and choose
Call counting option in the
drop-down pane: